Universal Studios Wait Times for October 2024
Universal Orlando Resort has theoretically entered the slow season.
Now, diehard fans know better, as it’s really the most wonderful time of the year.

Image: Universal Studios
With Halloween Horror Nights in full swing, Universal Studios devotees are eating good.
Still, park attendance fell nearly ten percent in 2023, and it’s dropped even more in 2024.

Image: Universal Studios
So, the Universal Studios wait times for October 2024 will probably indicate at least some slowdown. Let’s take a look.
About Universal Studios
Image: Universal Studios
In about three weeks, Comcast will reveal its quarterly fiscal earnings.
During this conversation, NBCUniversal’s balance sheet will be on full display, including some hard numbers regarding the theme parks.

Image: Universal Studios
During the most recent earnings report, Comcast confirmed that it’d experienced a lean summer, even though it only had data through mid-August.
As we all know, school is back in session by that point, though. So, Comcast already knew the pertinent data.

Image: Universal
The corporation warned investors that it expected the parks to remain soft for the rest of the year.
We’re now bearing witness to that fact as we examine the attraction wait times.
Universal Studios Florida – The Big Five

As usual, we’ll home in on a handful of attractions at Universal Studios Florida.
These five rides provide the backbone for the park’s current crowd behavior, as they’re the anchor attractions.
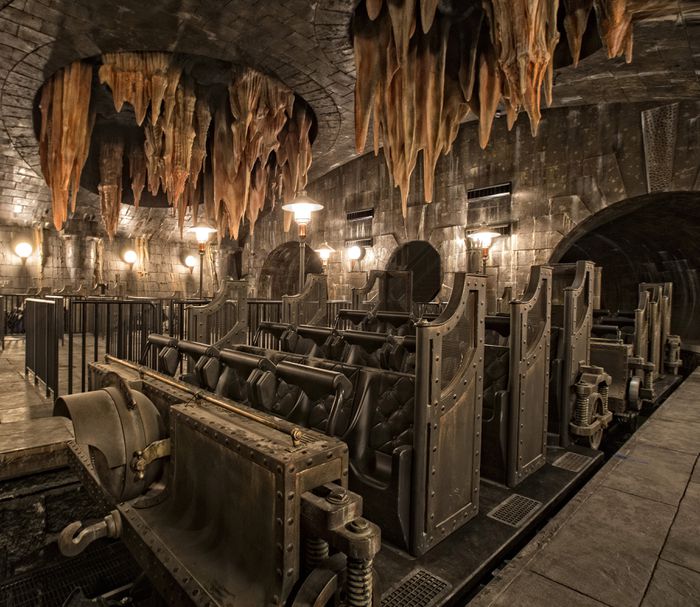
Photo: Universal
The one with the longest wait during the past month was Harry Potter and the Escape from Gringotts.
The evergreen Potterverse ride averaged a wait of 47 minutes, which is six minutes more than last time.

Photo: Universal
Meanwhile, the park’s other exceptional Big Five roller coaster, Revenge of the Mummy, averaged a 32-minute wait.
That’s four minutes less than last time. And yes, I just took a cheap shot at Hollywood Rip Ride Rockit.

Image Credit: Universal
The floundering coaster averaged a wait of 23 minutes, a drop of ten minutes. It has…fallen out of favor.
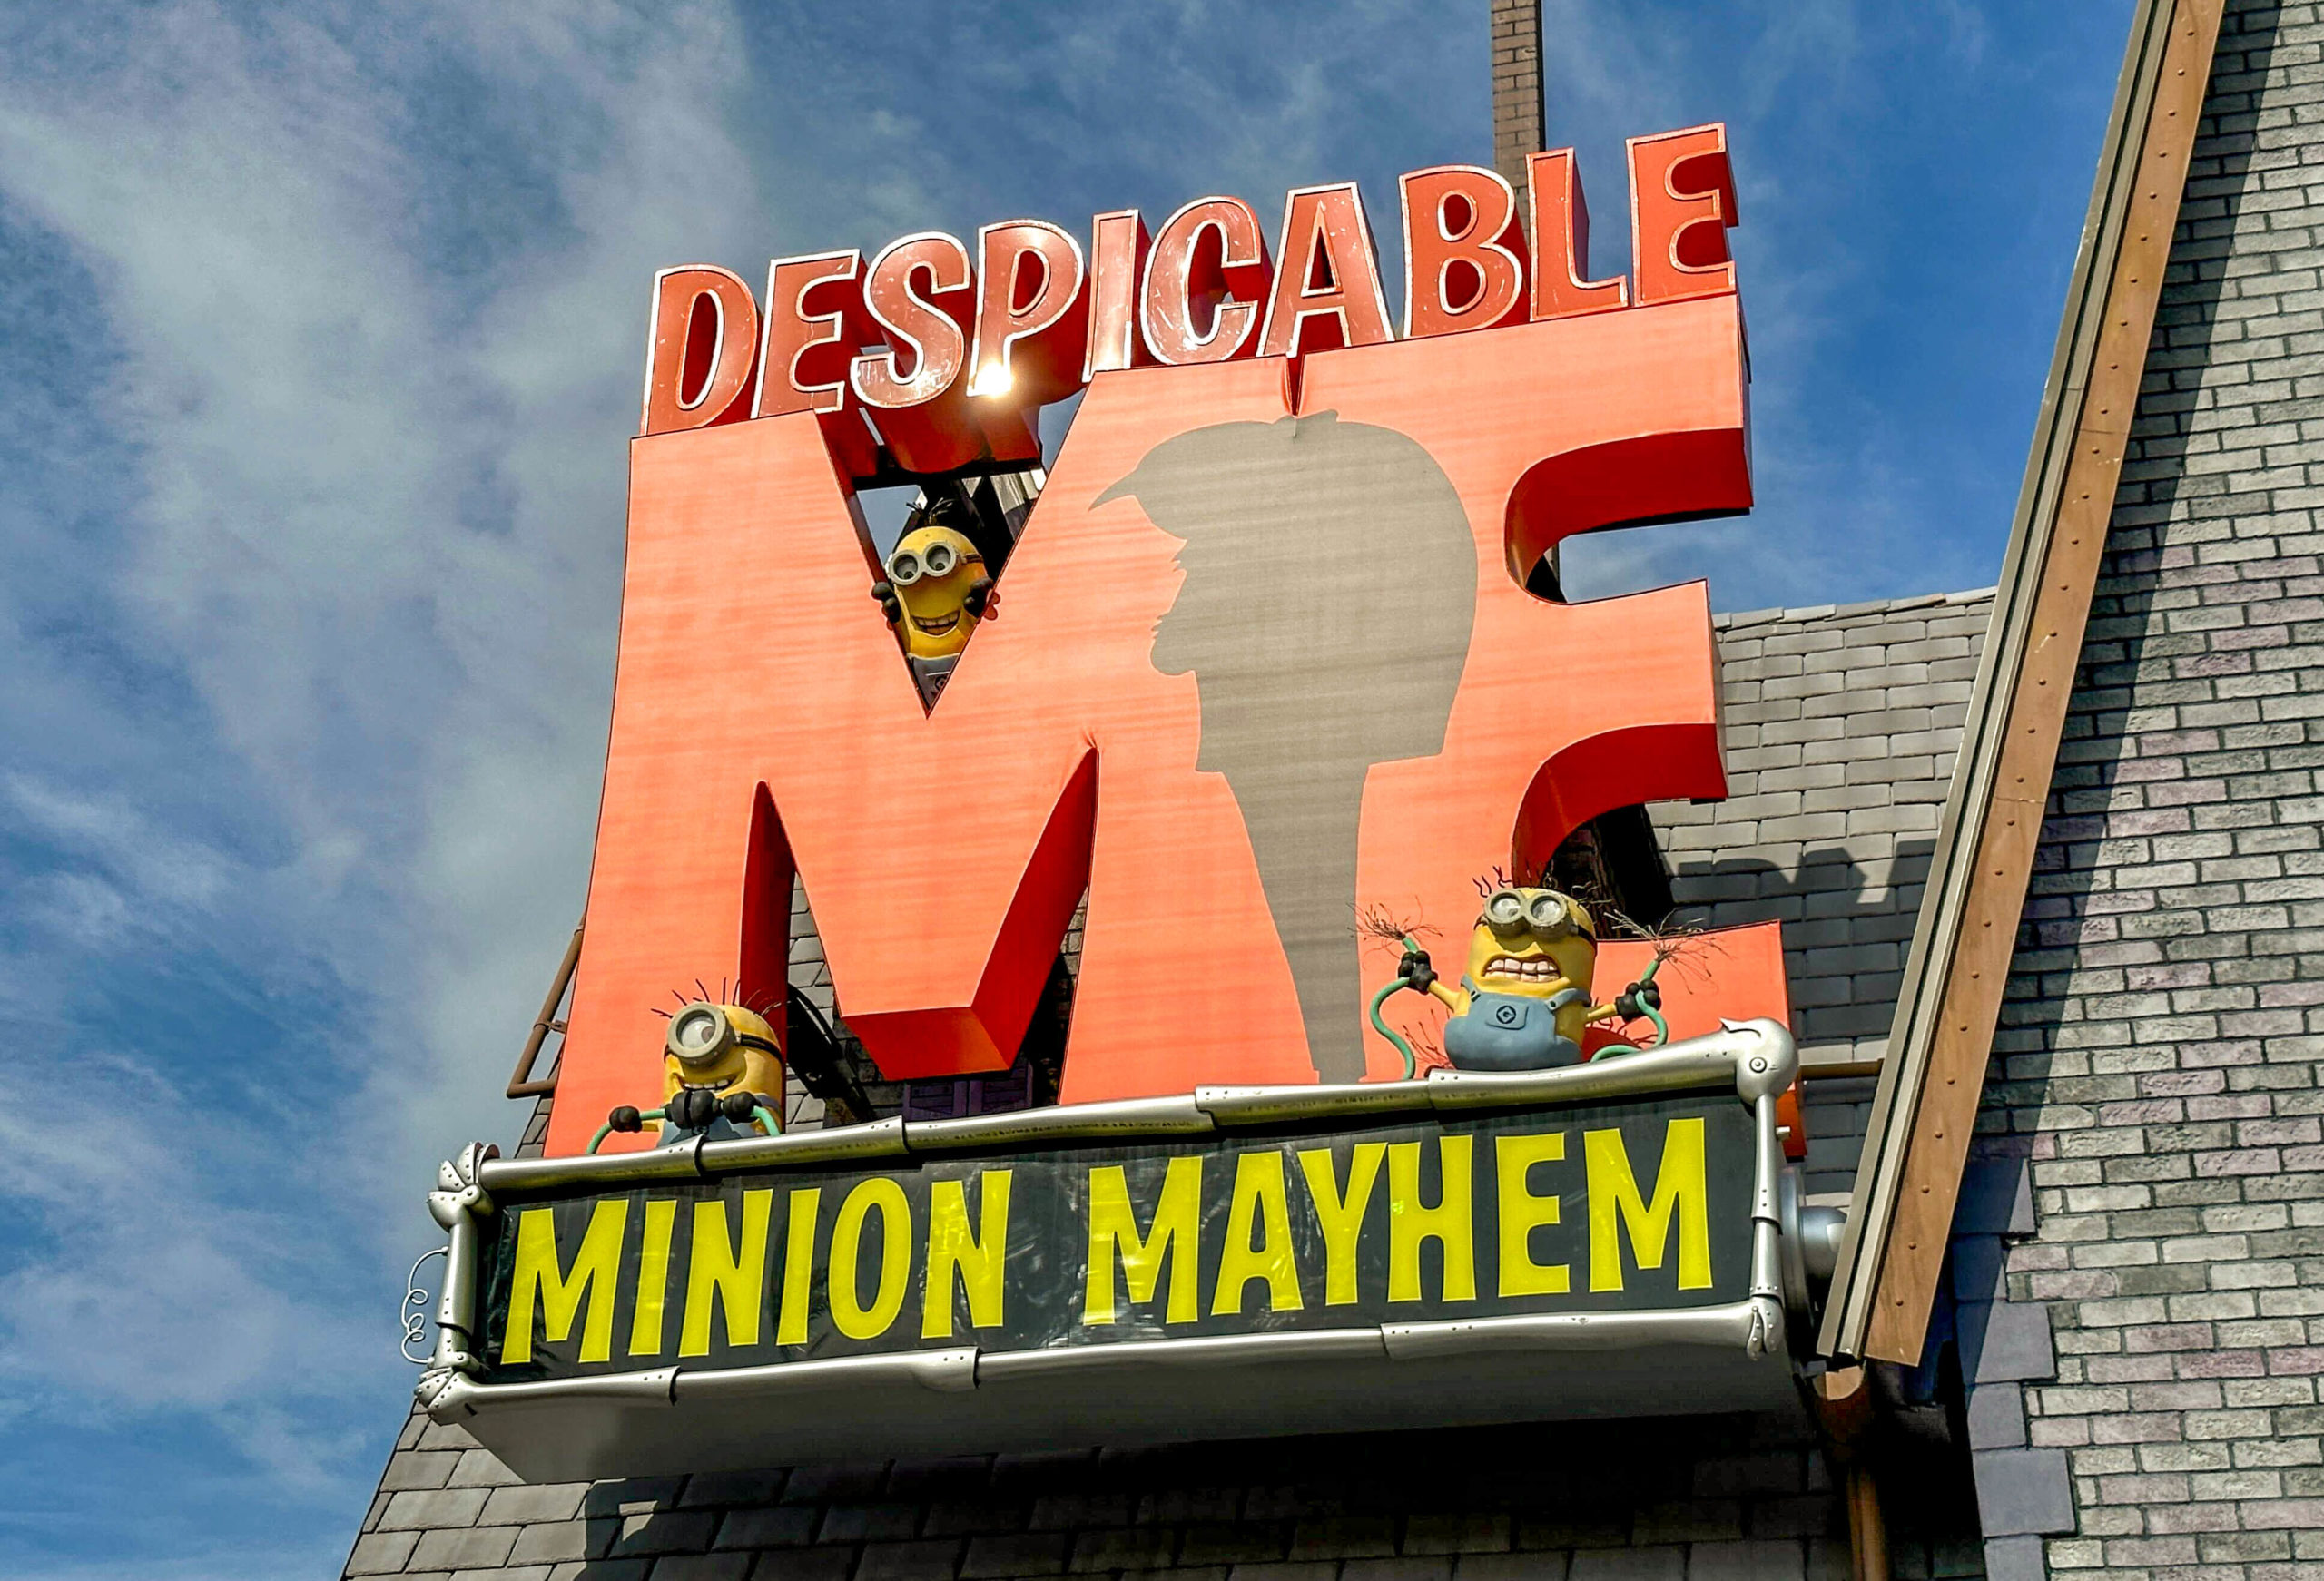
At Minion Land, Despicable Me: Minion Mayhem also tanked in popularity, falling 14 minutes to a 34-minute average.
Finally, Illumination’s Villain Con Minion Blast plummeted to 12 minutes.
That’s a drop of six minutes and the lowest average wait time we’ve ever tracked for the attraction.
When Minion Blast opened last year, I mentioned that its throughput assured this sort of long-term behavior.
The Minions ride can host a massive number of guests on its moving sidewalks.
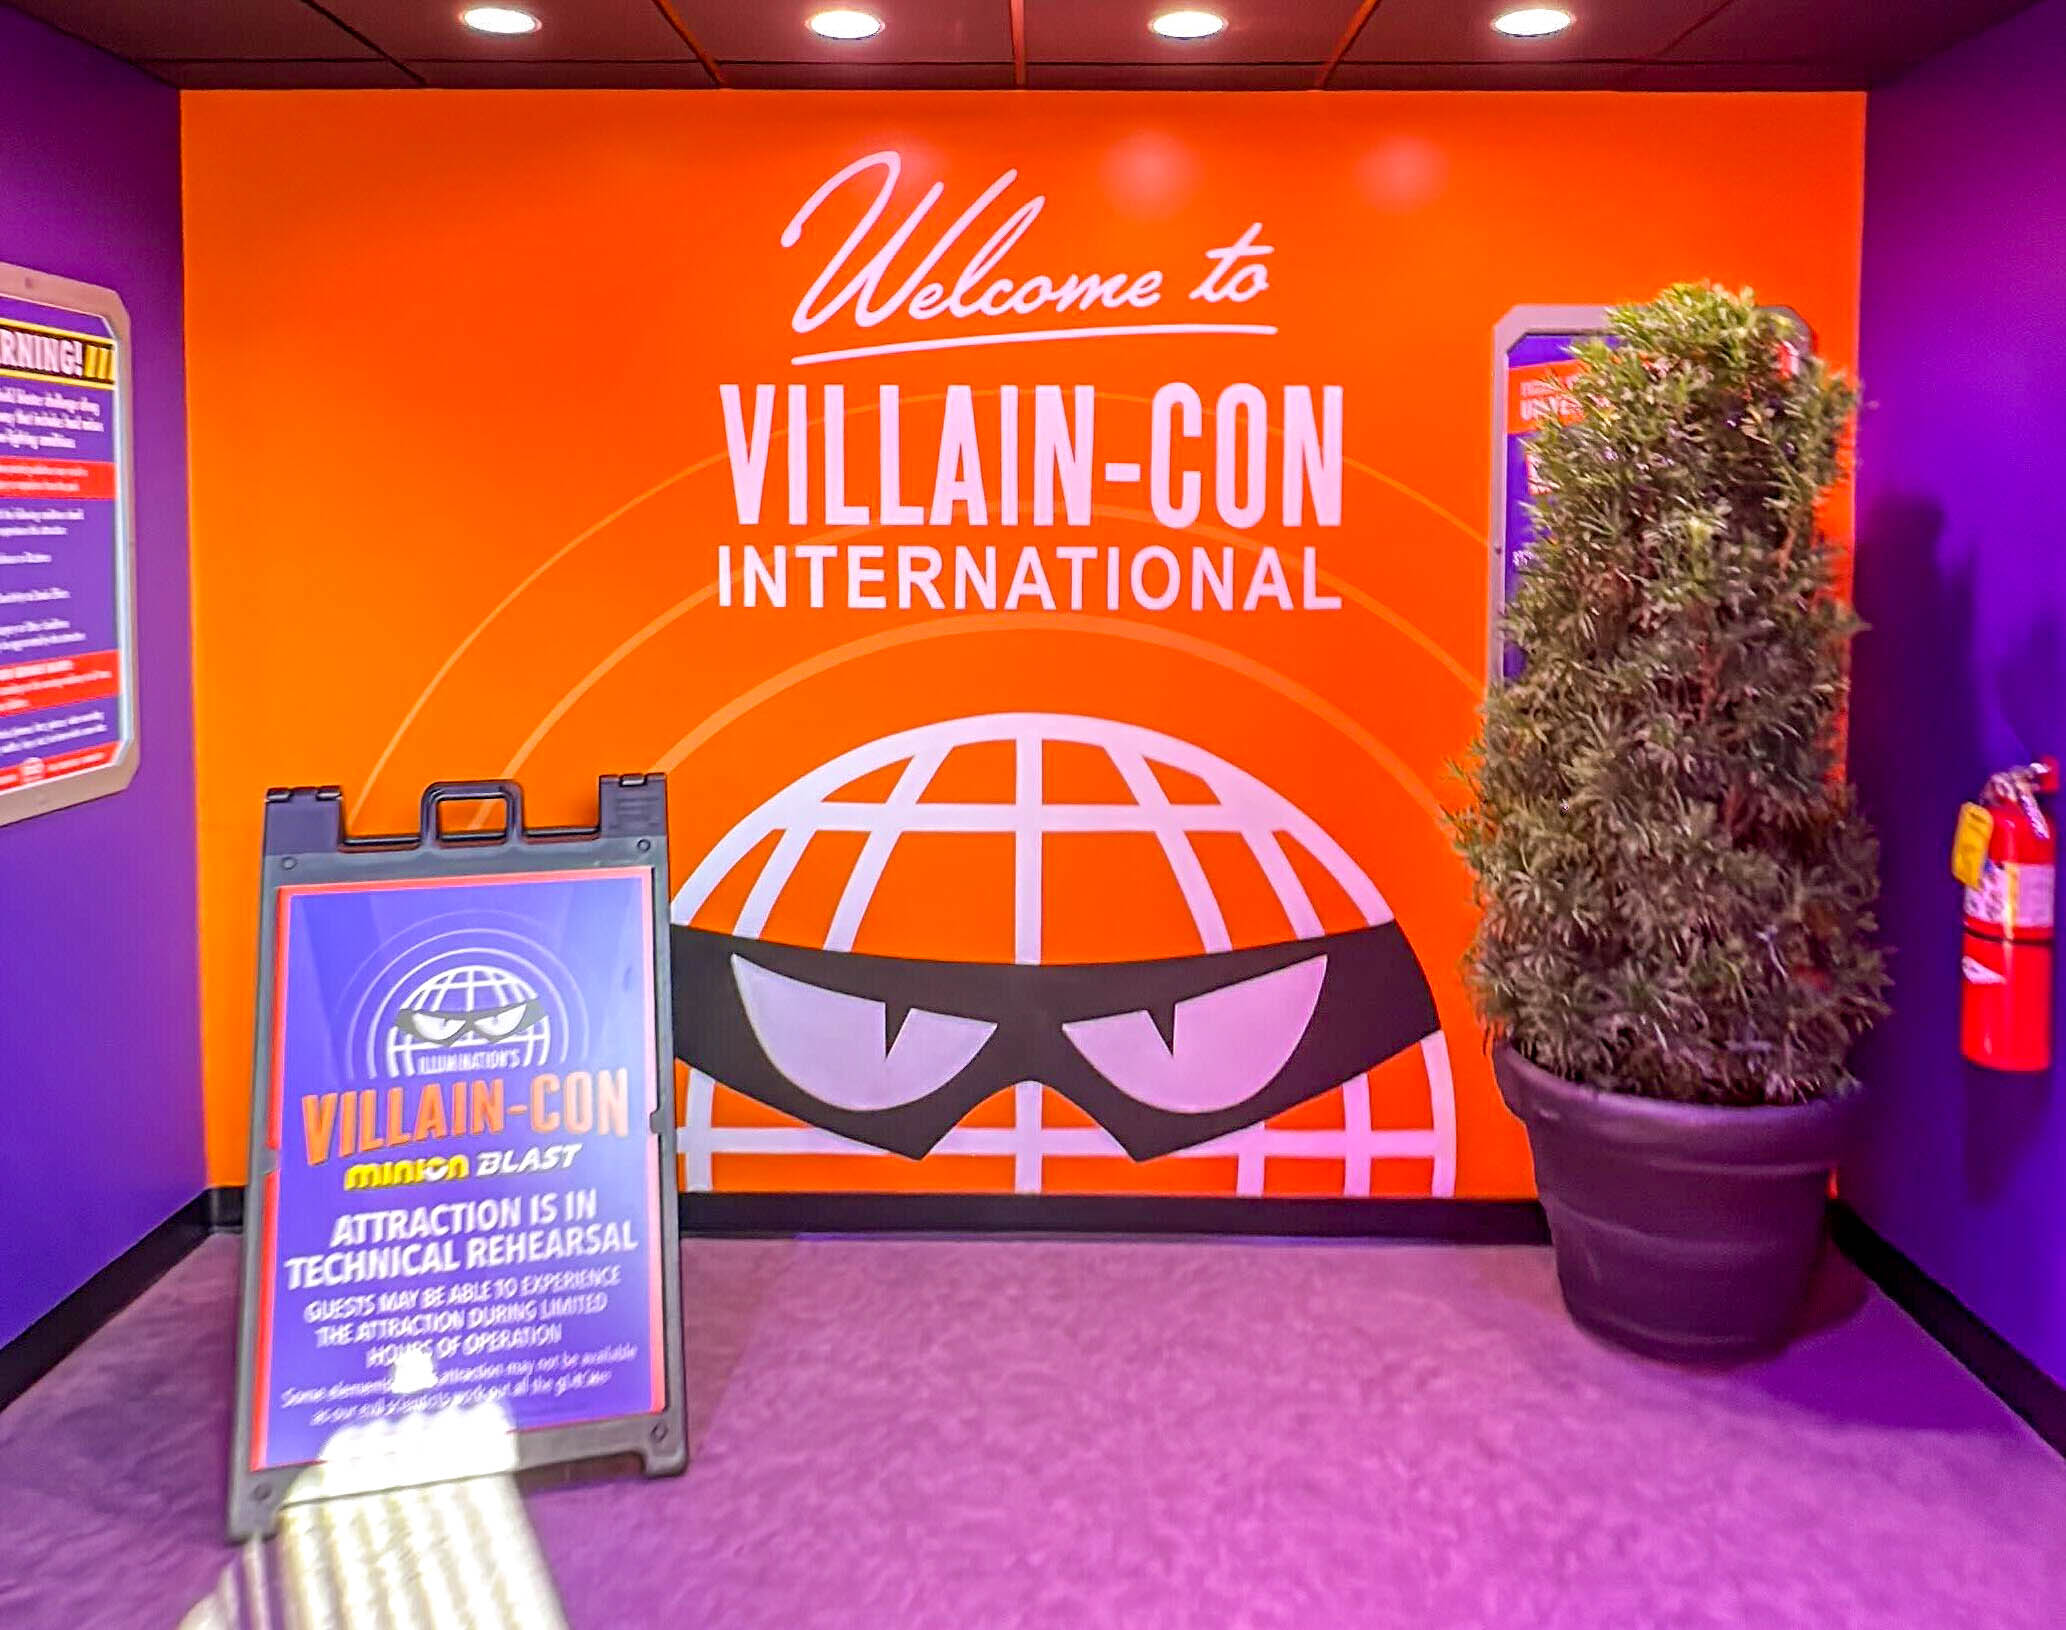
Villain-Con Minion Blast
So, once Universal met initial demand, it was going to slow down.
Still, I think park officials would admit that a drop to 12 minutes in a calendar year is a bit worrisome.
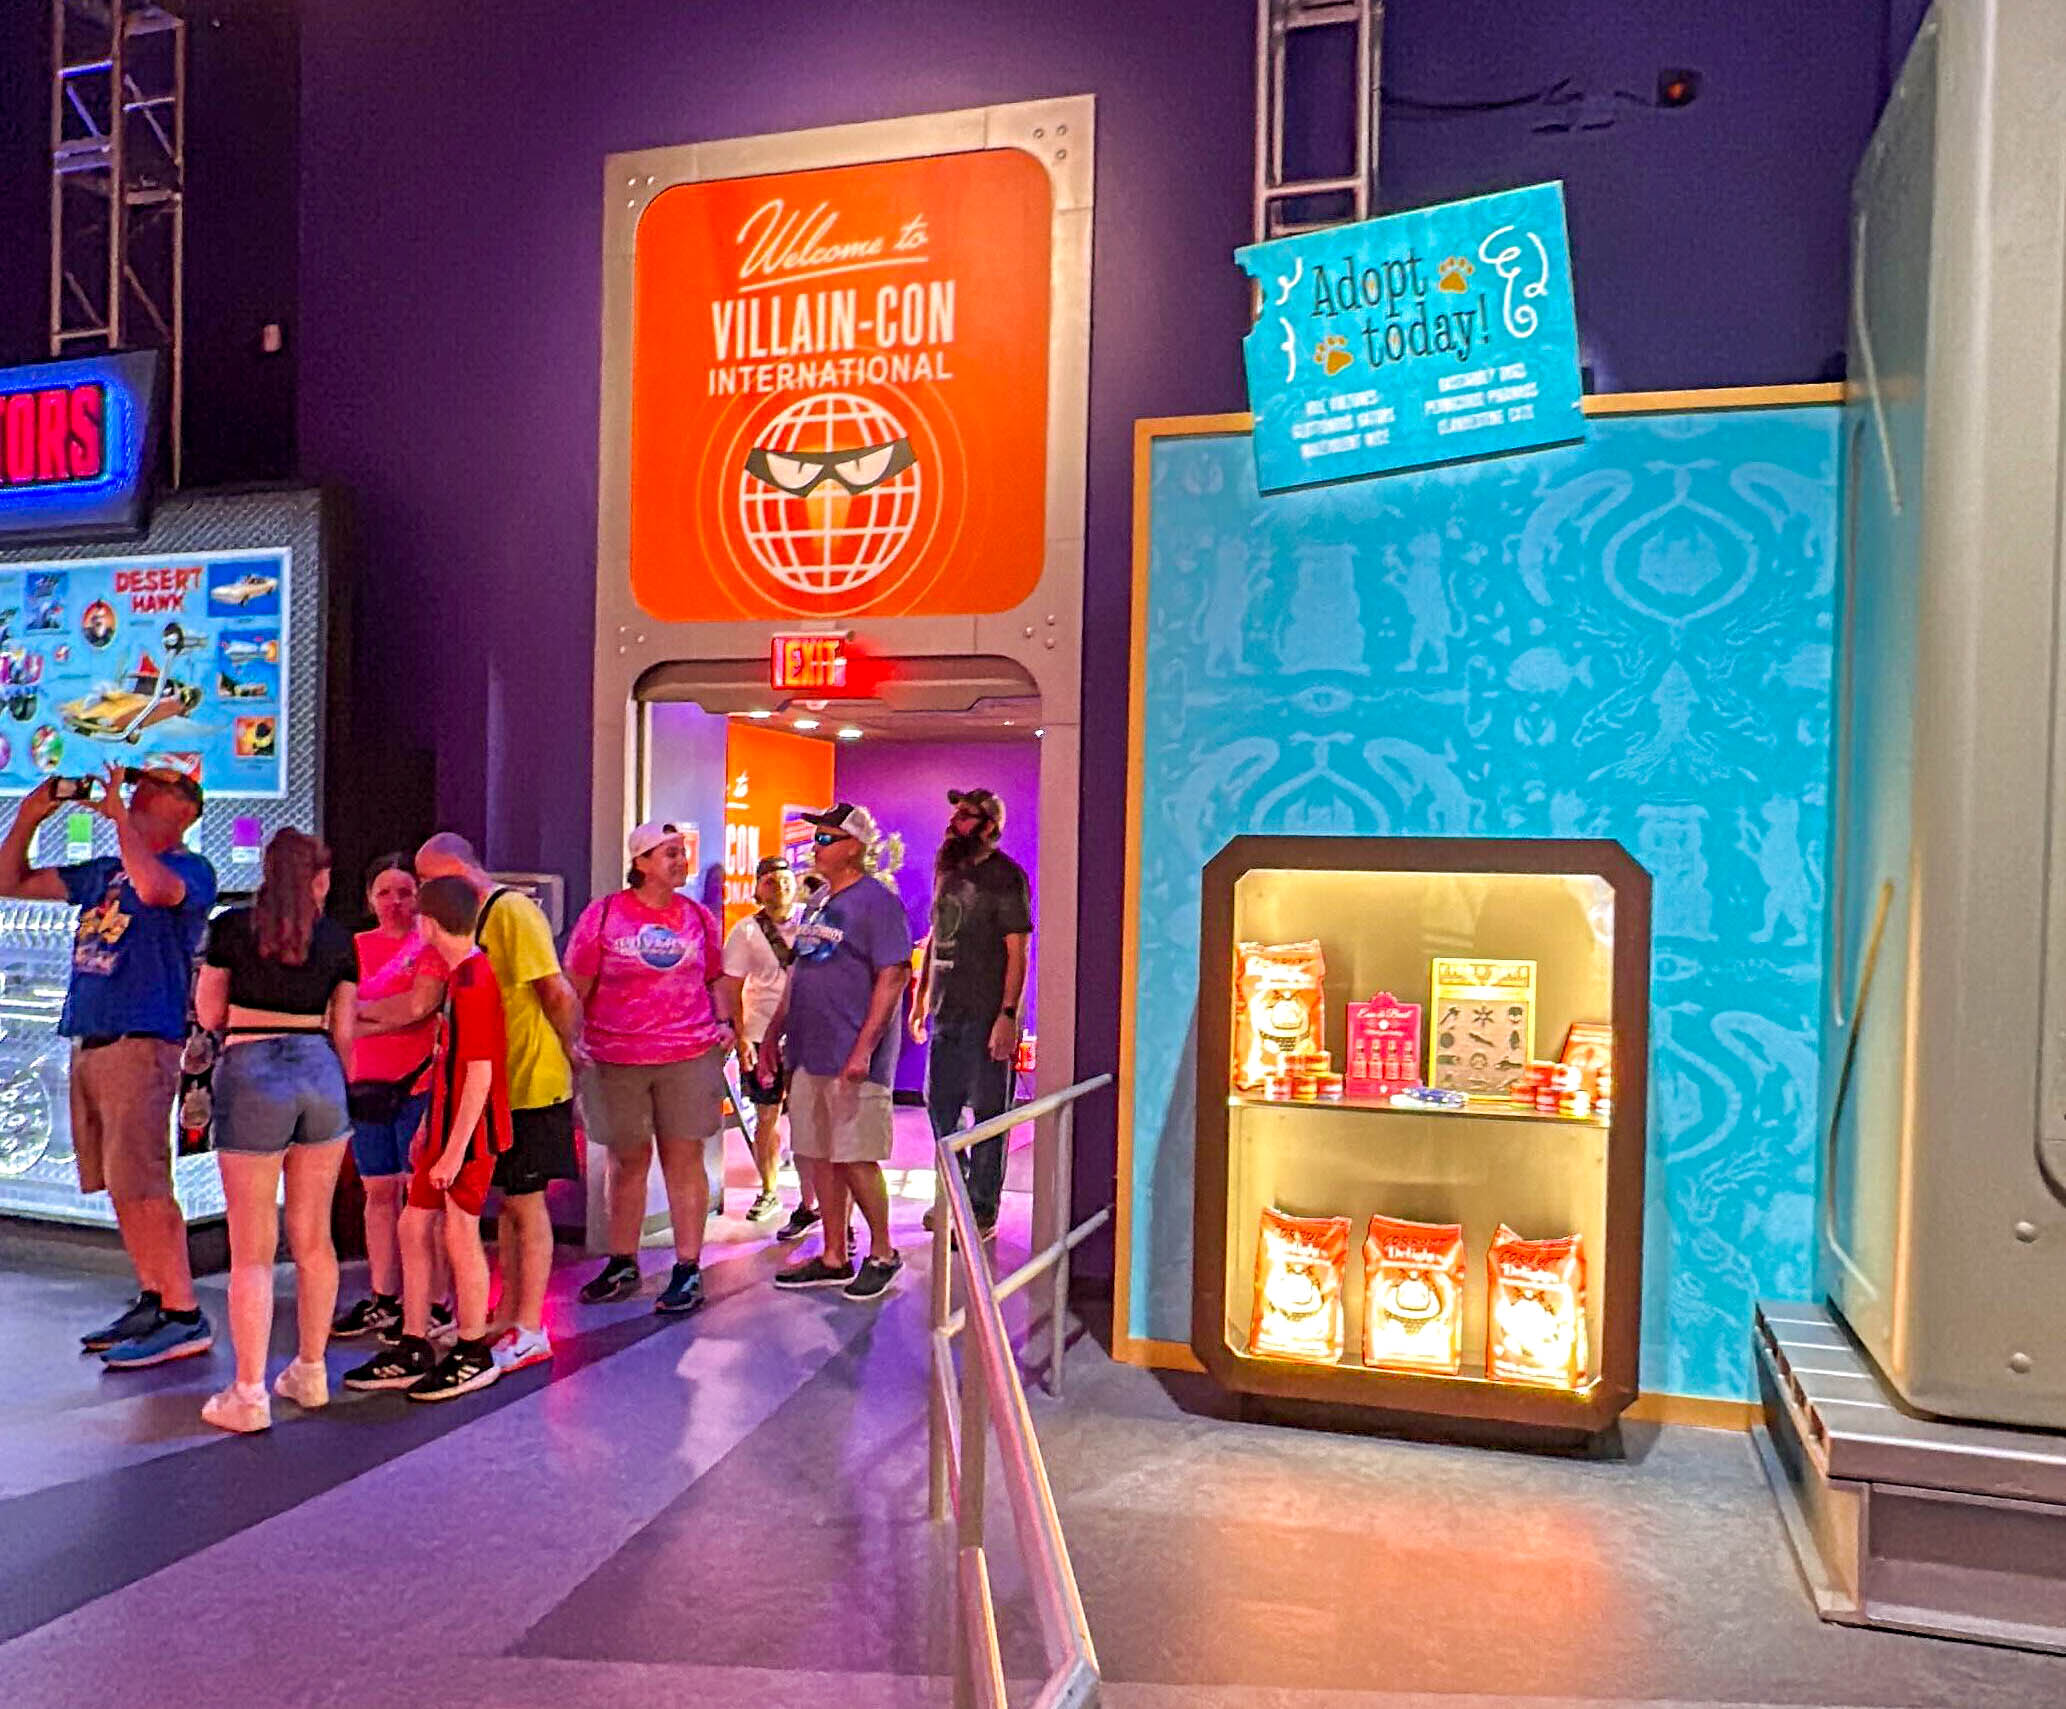
At this time a year ago, Minion Blast was still averaging a 32-minute wait. Yikes!
Universal Studios Florida – Everything Else

Photo: USA Today
Then, we have the remaining park offerings. Here are the average wait times for the other attractions at Universal Studios Florida:
- Hogwarts Express – King’s Cross Station – 37 minutes, up 7
- TRANSFORMERS: The Ride 3D – 31 minutes, down 5
- T. Adventure – 30 minutes, down 3
- The Simpsons Ride – 27 minutes, down 6
- Race Through New York Starring Jimmy Fallon – 23 minutes, down 5
- Trolls Trollercoaster – 22 minutes, down 8
- MEN IN BLACK Alien Attack! – 21 minutes, down 4
- Kang & Kodos’ Twirl ‘n’ Hurl – 15 minutes, down 7

Photo: Universal
Overall, park guests waited for an average of 28 minutes per attraction, which is three minutes less than the previous month.
However, that total is right in line with 2023’s 29 minutes per attraction for the same month.
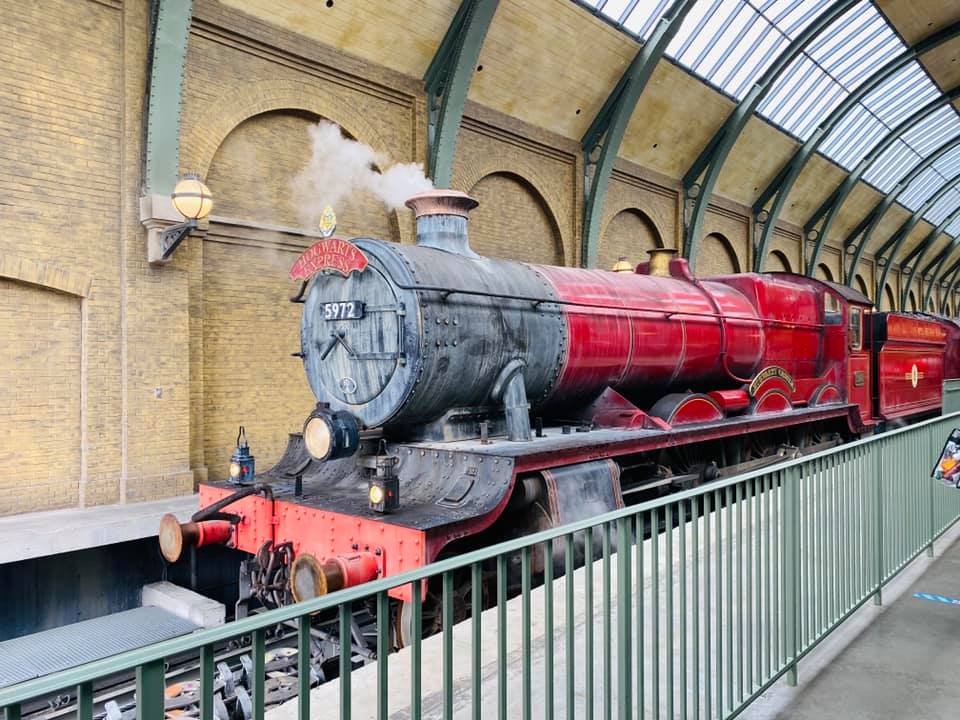
There’s one attraction whose behavior flew in the face of everything else, and that’s Hogwarts Express.
This behavior is neither new nor surprising. As a reminder, guests must leave the park early for Halloween Horror Nights (HHN).

Photo: Universal
So, a mob often forms as guests await a train ride to the neighboring park.
Universal’s Islands of Adventure

Image: Universal
The above behavior sometimes – but not always – artificially inflates the average wait times at Islands of Adventure.
Typically, the nightly waits drop as the park thins out. During HHN, there’s a counterbalance in play.
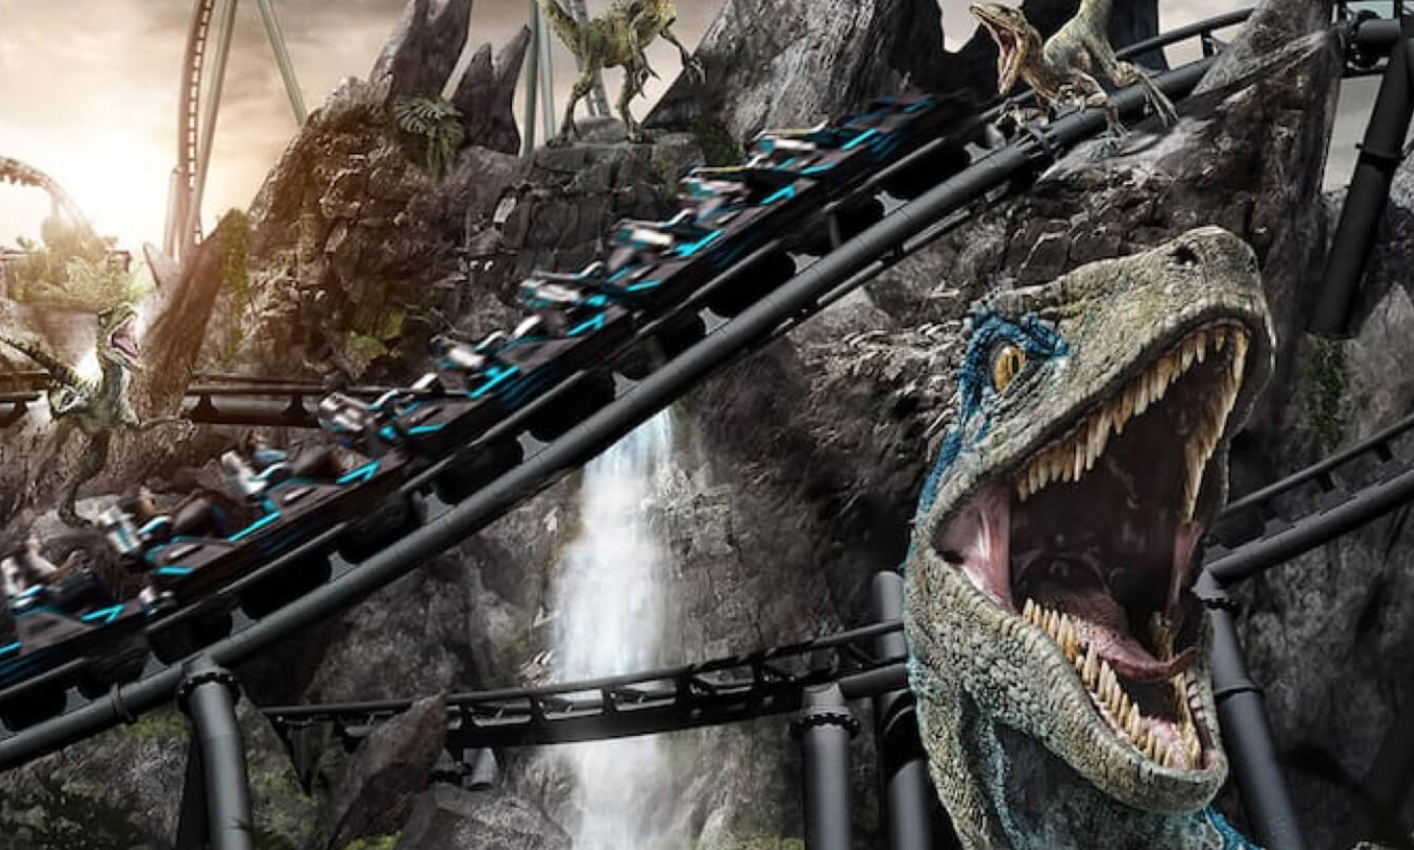
Photo: Universal Orlando
The Universal Studios Florida guests who aren’t attending the after-hours event invade the other park.
How big a factor was that last month? Let’s find out! Here are the average wait times at Islands of Adventure:
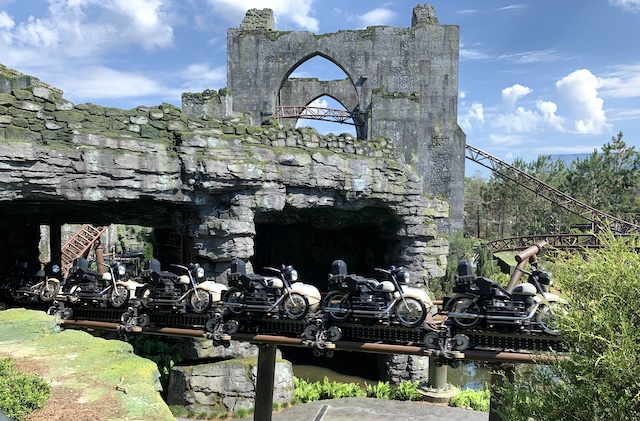
Photo: Theme Park Insider
- Hagrid’s Magical Creature Motorbike Adventures – 79 minutes, up 5
- Jurassic World VelociCoaster – 47 minutes, down 4
- Flight of the Hippogriff – 37 minutes, up 7
- Dudley Do-Right’s Ripsaw Falls – 33 minutes, down 20
- Harry Potter and the Forbidden Journey – 24 minutes, down 5
- The Amazing Adventures of Spider-Man – 23 minutes, down 11
- The Incredible Hulk Coaster – 22 minutes, down 12
- Skull Island: Reign of Kong – 21 minutes, down 7
- Hogwarts Express – Hogsmeade Station – 18 minutes, down 6
- Jurassic Park River Adventure – 18 minutes, down 8
- Doctor Doom’s Fearfall – 16 minutes, up 1
- Popeye & Bluto’s Bilge-Rat Barges – 14 minutes, down 7
- The High in the Sky Seuss Trolley Train Ride! – 14 minutes, no change
- One Fish, Two Fish, Red Fish, Blue Fish – 10 minutes, down 4
- The Cat in the Hat – 9 minutes, down 4
- Caro-Seuss-el – 8 minutes, no change
- Storm Force Accelatron – 8 minutes, no change
About Islands of Adventure
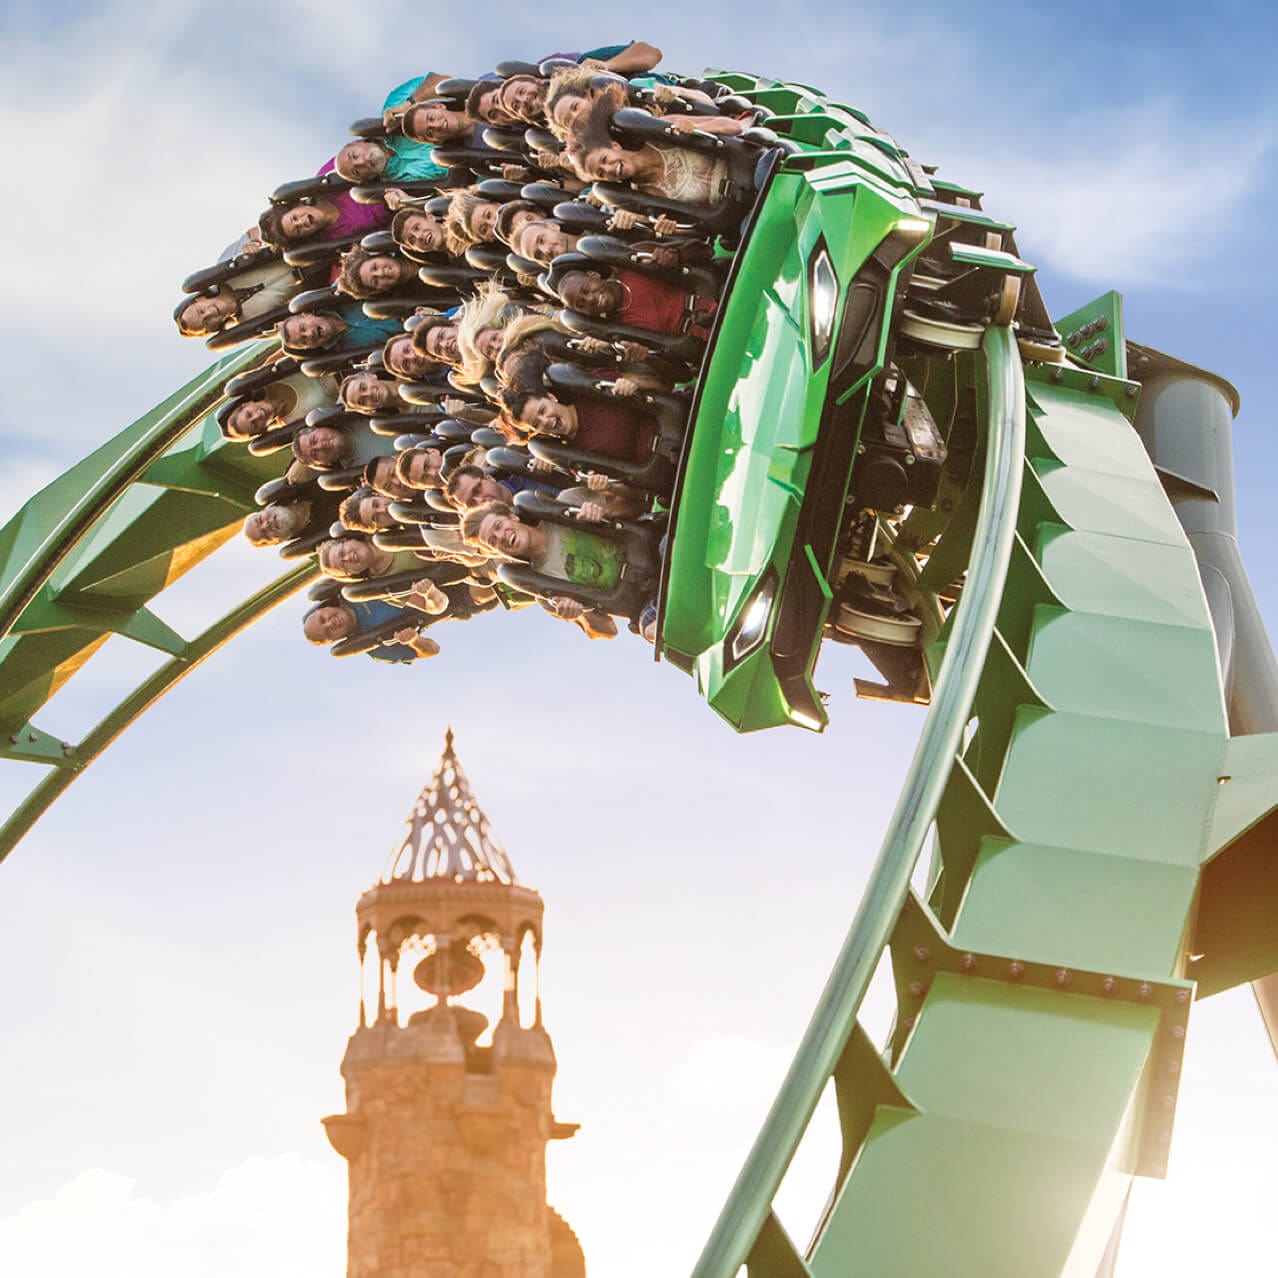
Photo: Universal
Okay, we found the theme park attendance vacuum, as Islands of Adventure attractions averaged a wait of 23 minutes.
That’s four minutes less than the previous month and one of the lowest totals I’ve tracked since, like, 2018.

Photo: Universal Orlando
Last year’s numbers were only marginally different, with an average of 25 minutes, but we’re approaching the logical extreme here.
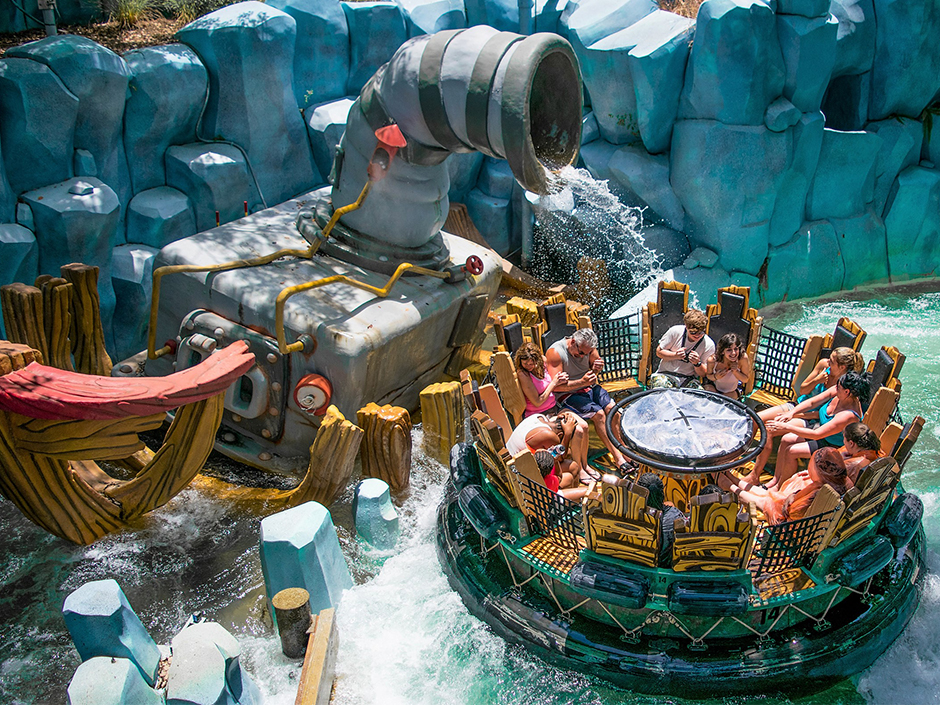
The wet rides dropped in popularity due to the cooler temperatures, while the thrill rides almost universally dropped in popularity.
Folks, Universal Studios desperately needs Epic Universe to open. The parks are sloooooow right now, and that’s with HHN going on!

Thanks for visiting UniversalParksBlog.com! Want to go to Universal? For a FREE quote on your next Universal vacation, please fill out the form below and one of the agents from Let’s Adventure Travel will be in touch soon!
Feature Photo: Universal

