Universal Studios Wait Times for November 2024
October has come to an end, which always causes sadness for Universal Studios fans.
The start of November typically means the end of Halloween Horror Nights.

Universal
This year works slightly differently, with the event running through November 3rd.
Still, we’ve pretty much come to the end of the road for 2024.

Soon, your favorite Halloween decorations will disappear, replaced by Christmas lights.
For some theme park fans, it’s a fair trade. For Universal diehards, it marks the end of the best time of the year.

We’re about to lose the Scare Zones and Houses until August 2025 arrives…but that’s okay!
Soon, House speculation will ensue, which is nearly as much fun as the event itself.

Until then, let’s look back at the past month at the parks.
Here are Universal Studios’ average wait times for November 2024.
Universal Studios Florida – The Big Five
As a reminder, since I share this article in November, I name it that way. However, we obviously don’t know November wait times yet.
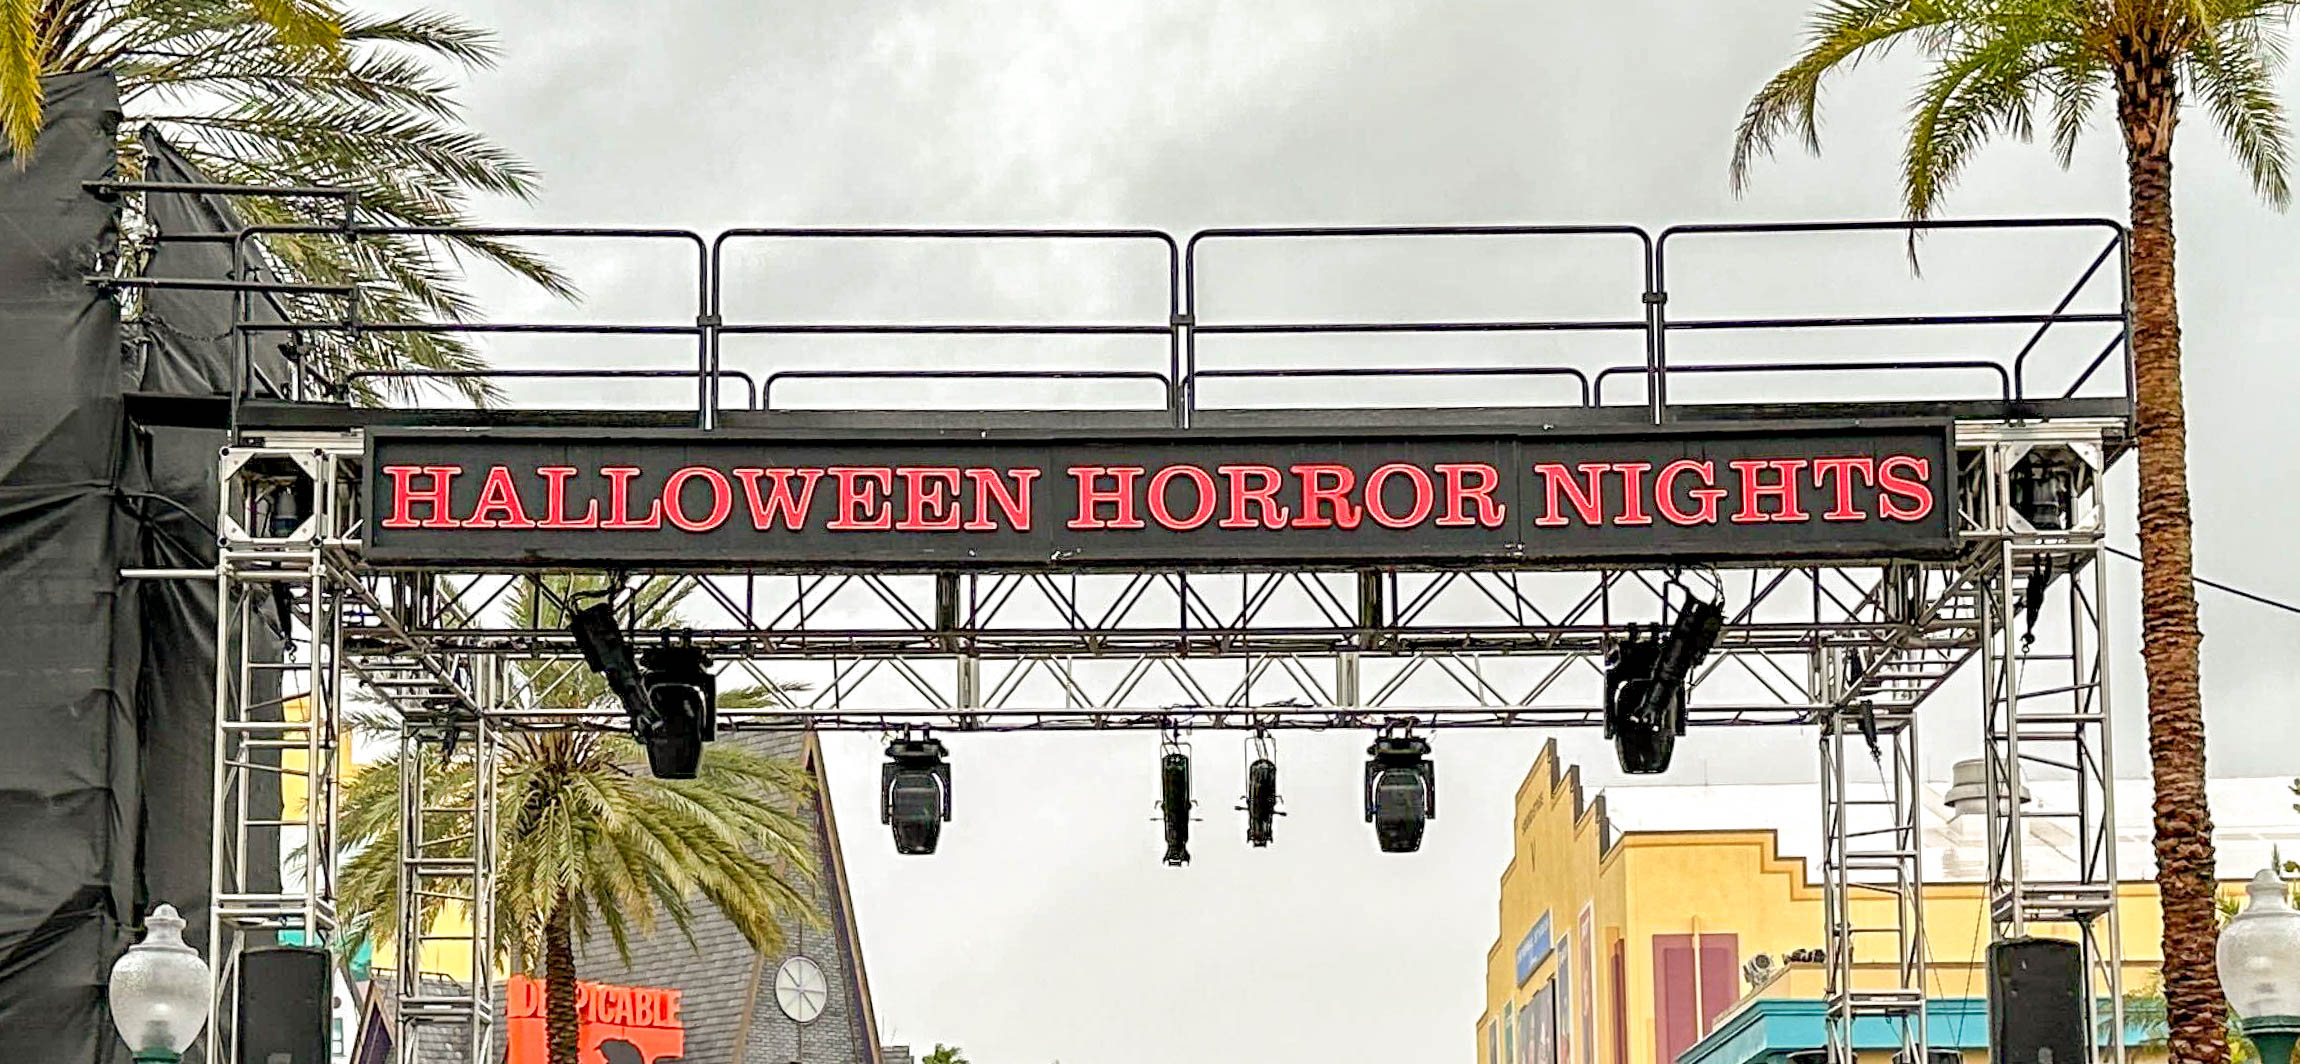
Instead, we’re discussing the wait times for the past month, some of which are artificially inflated by Halloween Horror Nights (HHN).
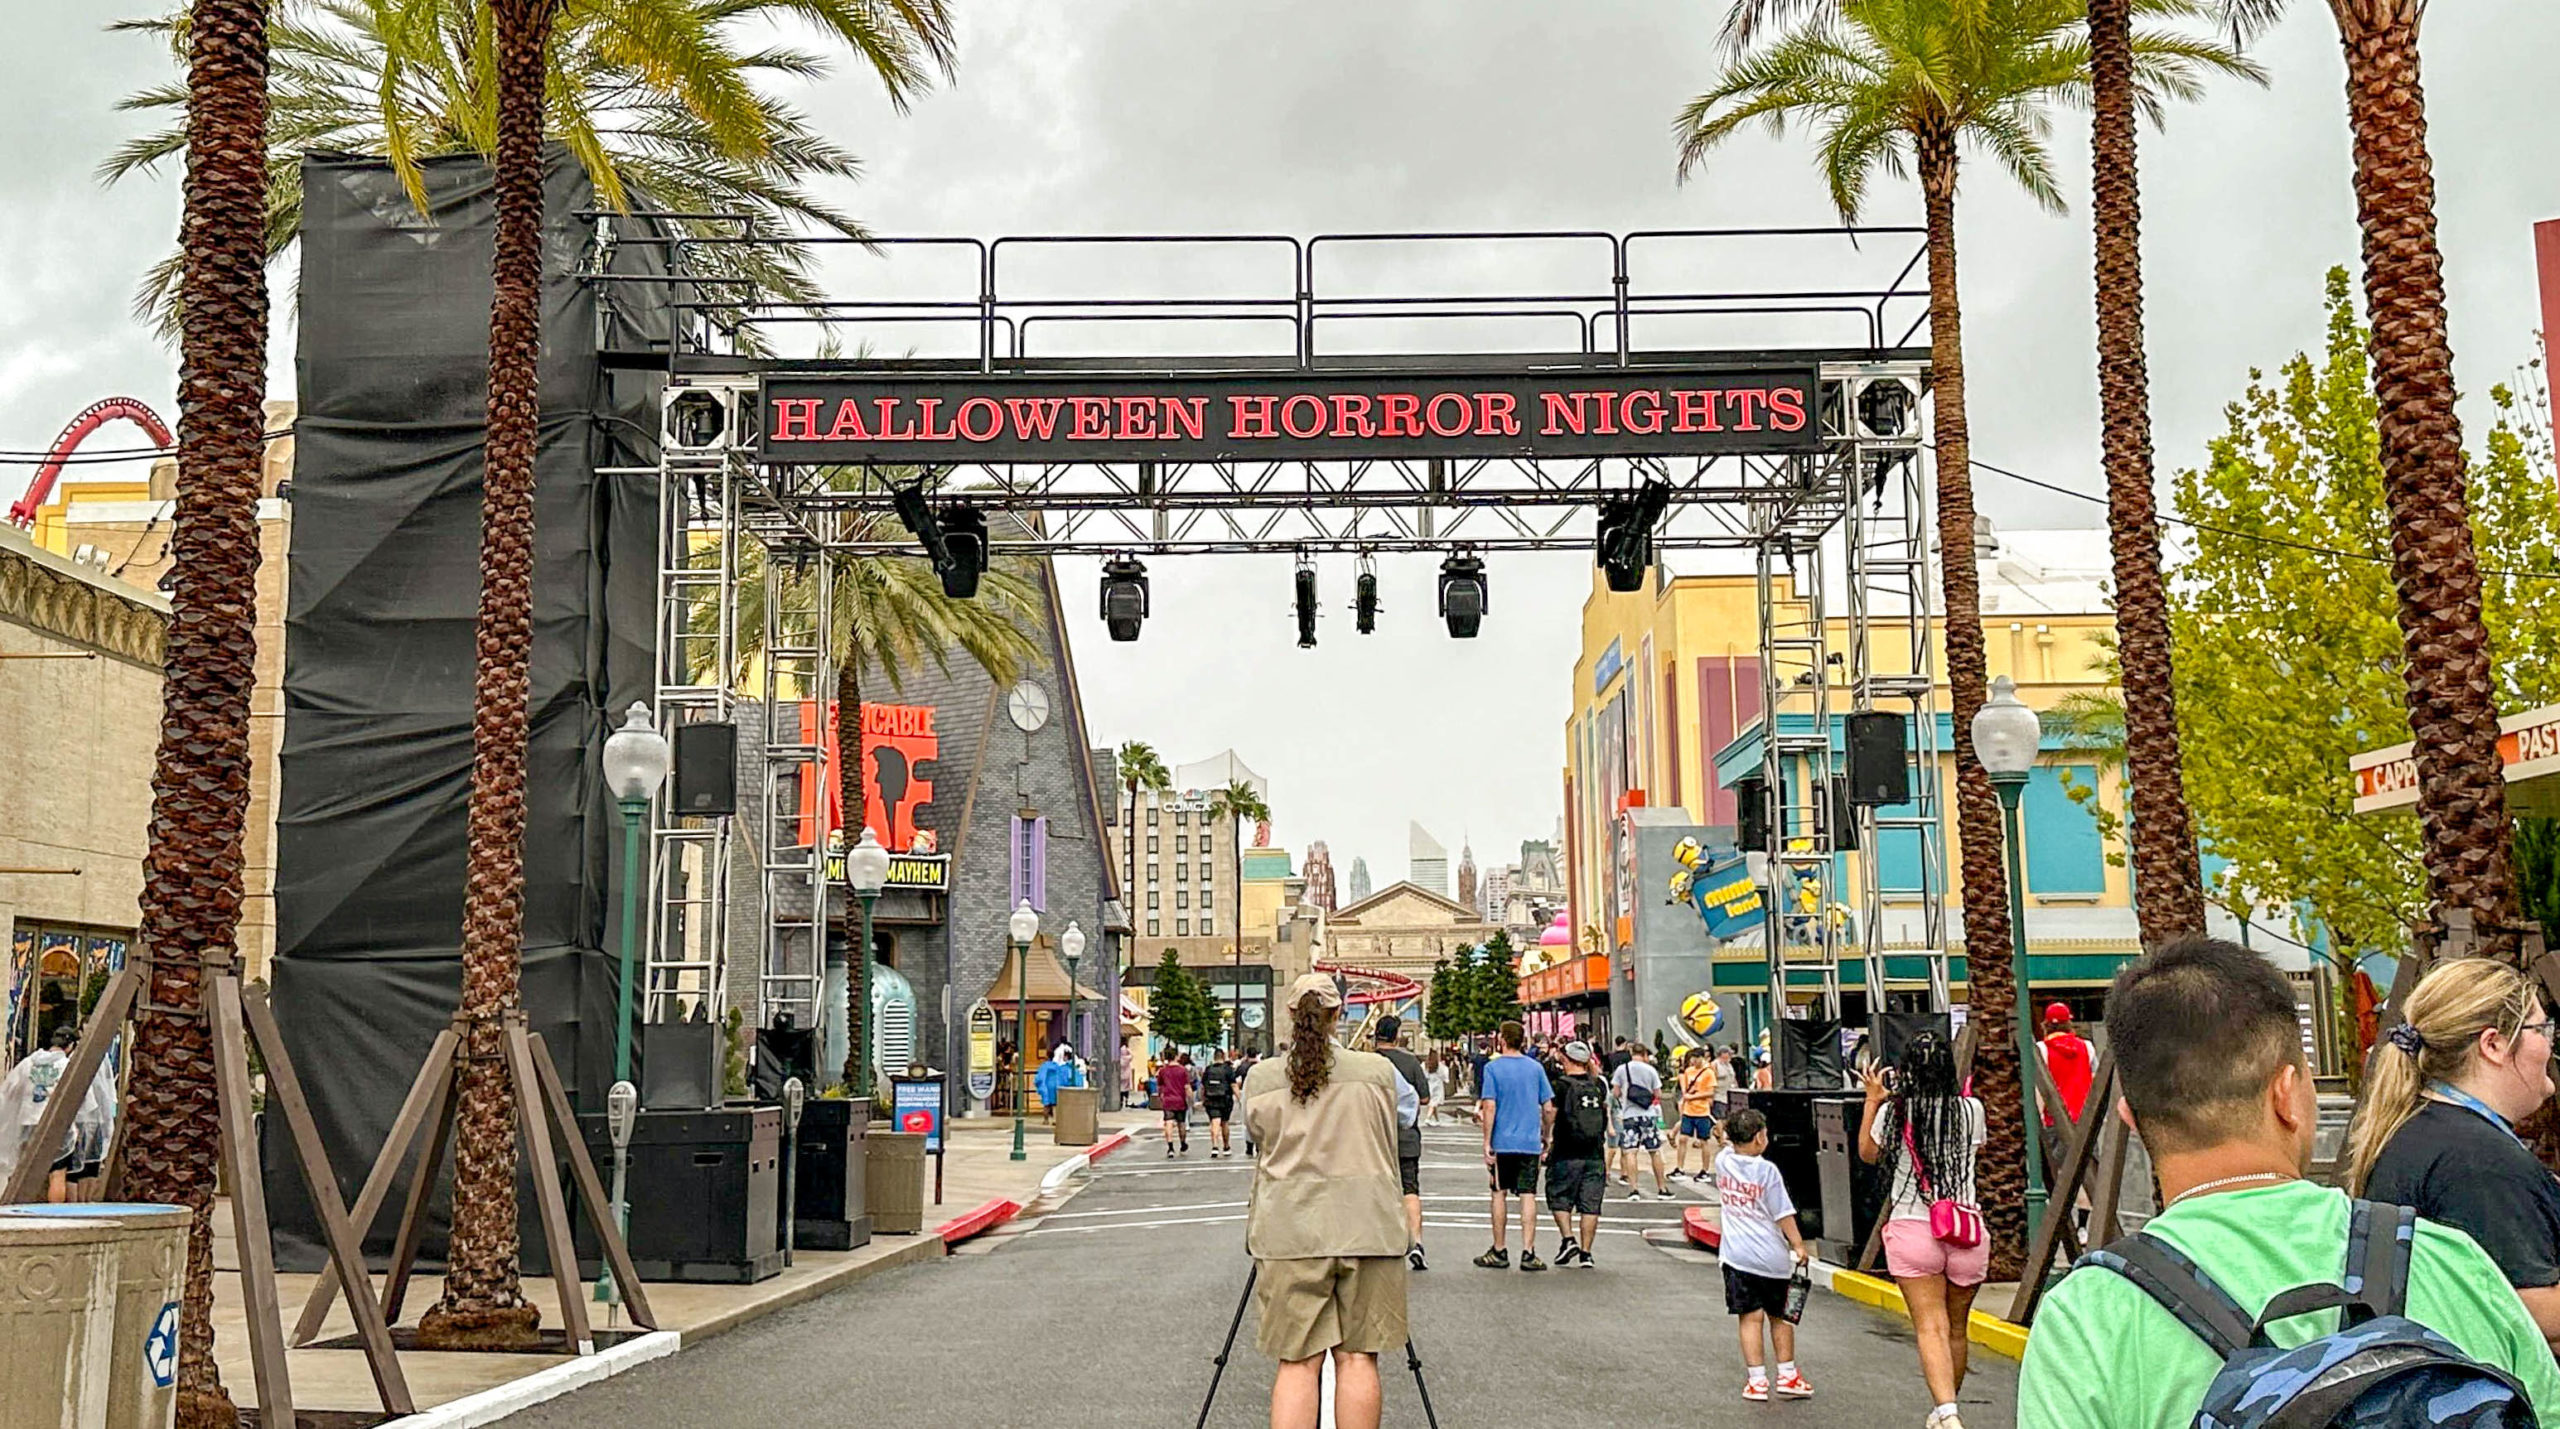
That’s because crowds tend to diminish later in the day, reducing wait times.
However, due to the way Universal Orlando Resort operates HHN, this behavior isn’t the norm in October.
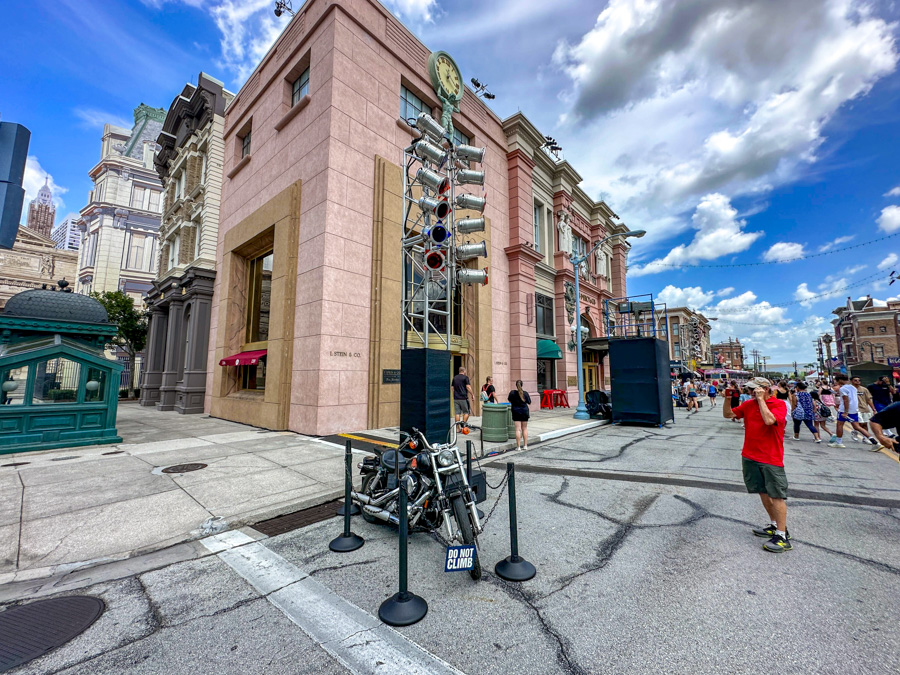
Instead, guests stay at Universal Studios Florida until it closes early for HHN.
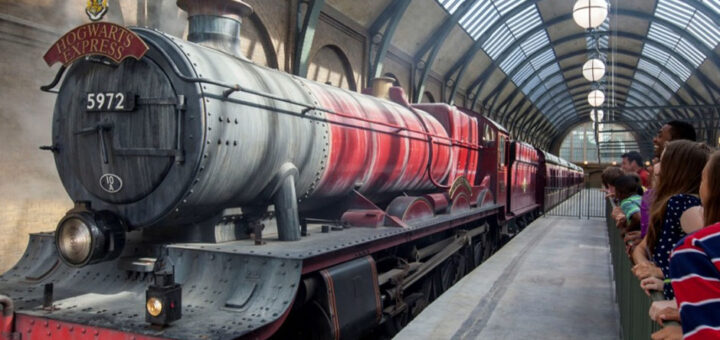
Then, they travel to Islands of Adventure to end the evening. So, the ride whose wait times typically increase is Hogwarts Express.
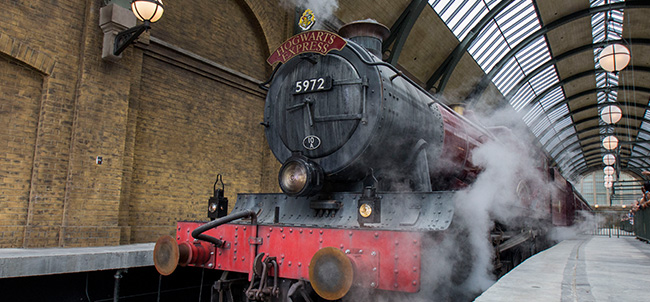
We’ll keep an eye on that one as we evaluate this month’s average wait times, starting with the Big Five at Universal Studios Florida.
During October, the most popular ride was Harry Potter and the Escape from Gringotts, which has become the norm in 2024.

For the month, the Gringotts combo dark ride and roller coaster averaged a wait of 55 minutes, which is eight minutes more than last time.
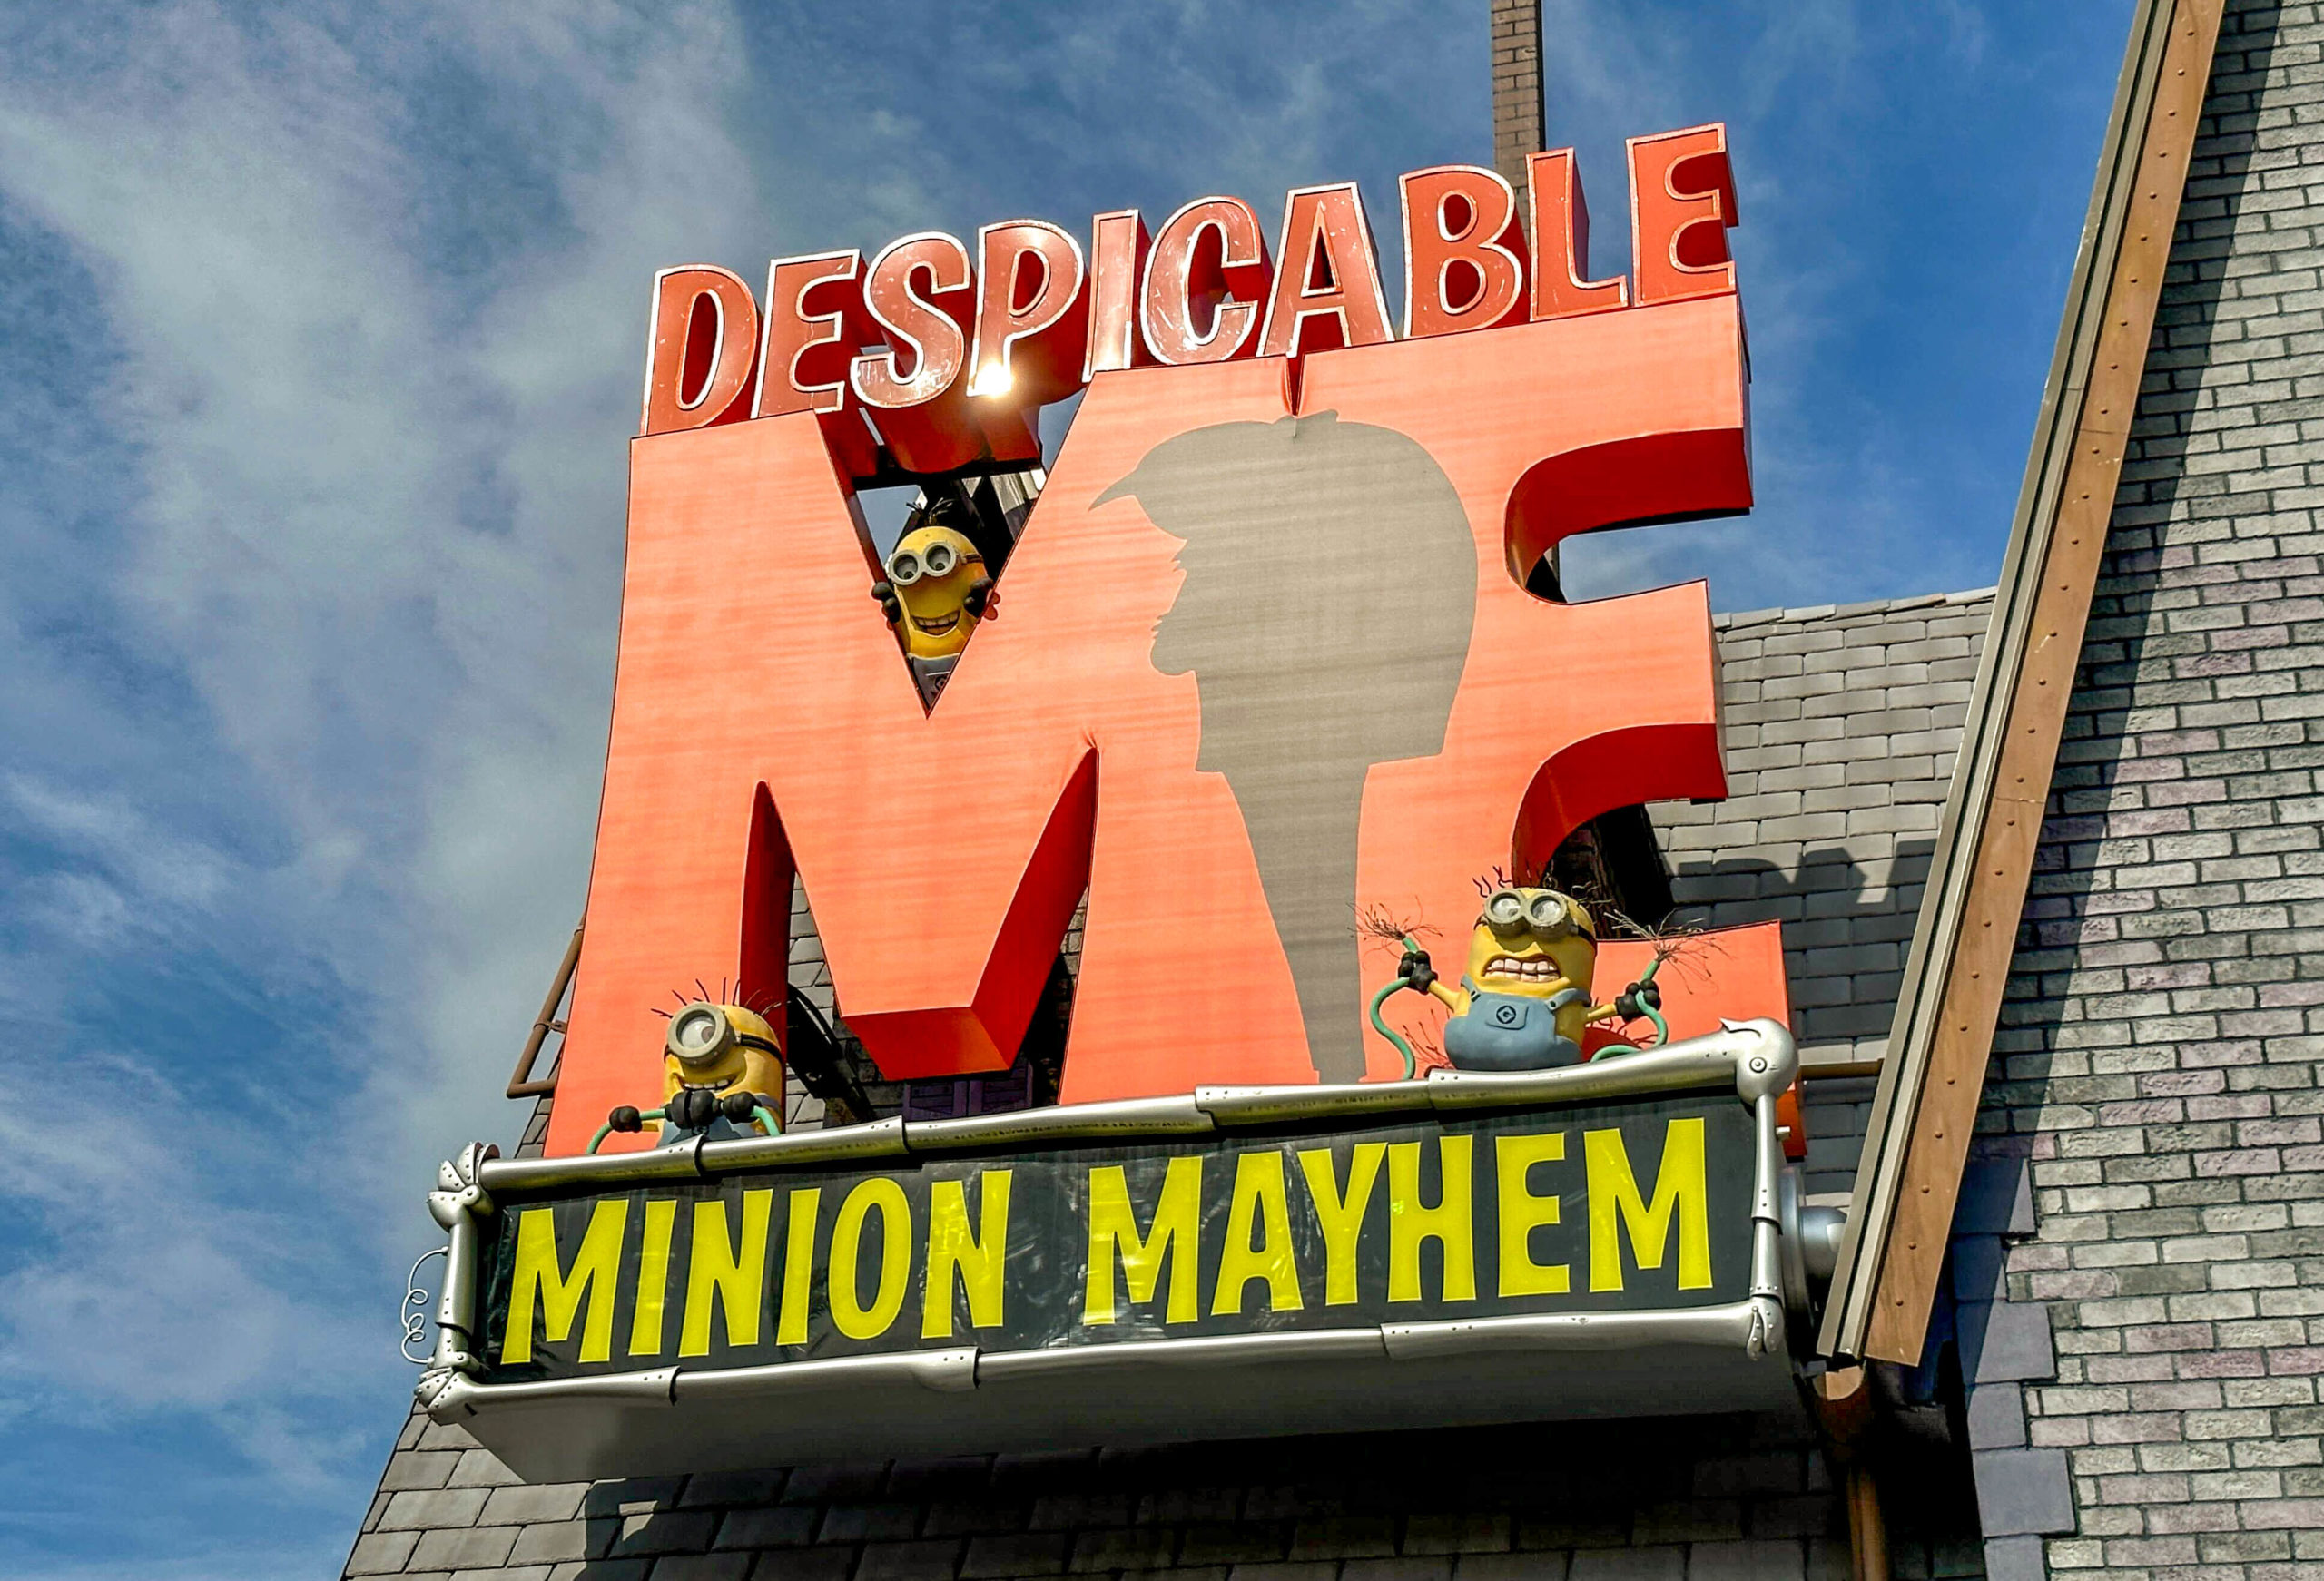
Next was Despicable Me: Minion Mayhem, which hovered in the 46-minute range, a sizable increase of 12 minutes from the prior month.
The other Minion ride, Illumination’s Villain-Con Minion Con, averaged a modest 16-minute wait, which is still up four minutes.
While that may not sound like much, it’s a 33 percent bump month-over-month.
Then again, the ride was ranging at 38 minutes at this time a year ago, when it was still new. So, this is likely its new range.
The two other members of the Big Five, Revenge of the Mummy and Hollywood Rip Rockit, averaged 39 minutes and 33 minutes, respectively.

Photo: Universal Orlando
Revenge of the Mummy went up by seven minutes, while Hollywood Rip Rockit jumped by ten minutes.
Universal Studios Florida – Everything Else
You can already tell the basics here, which you would have guessed anyway.
People flock to Universal Studios Florida during the final weeks of Halloween season.
Well, they do for the most popular attractions. Does this premise hold for everything else at Universal Studios Florida?
Let’s find out. Here are the park’s average wait times for last month:
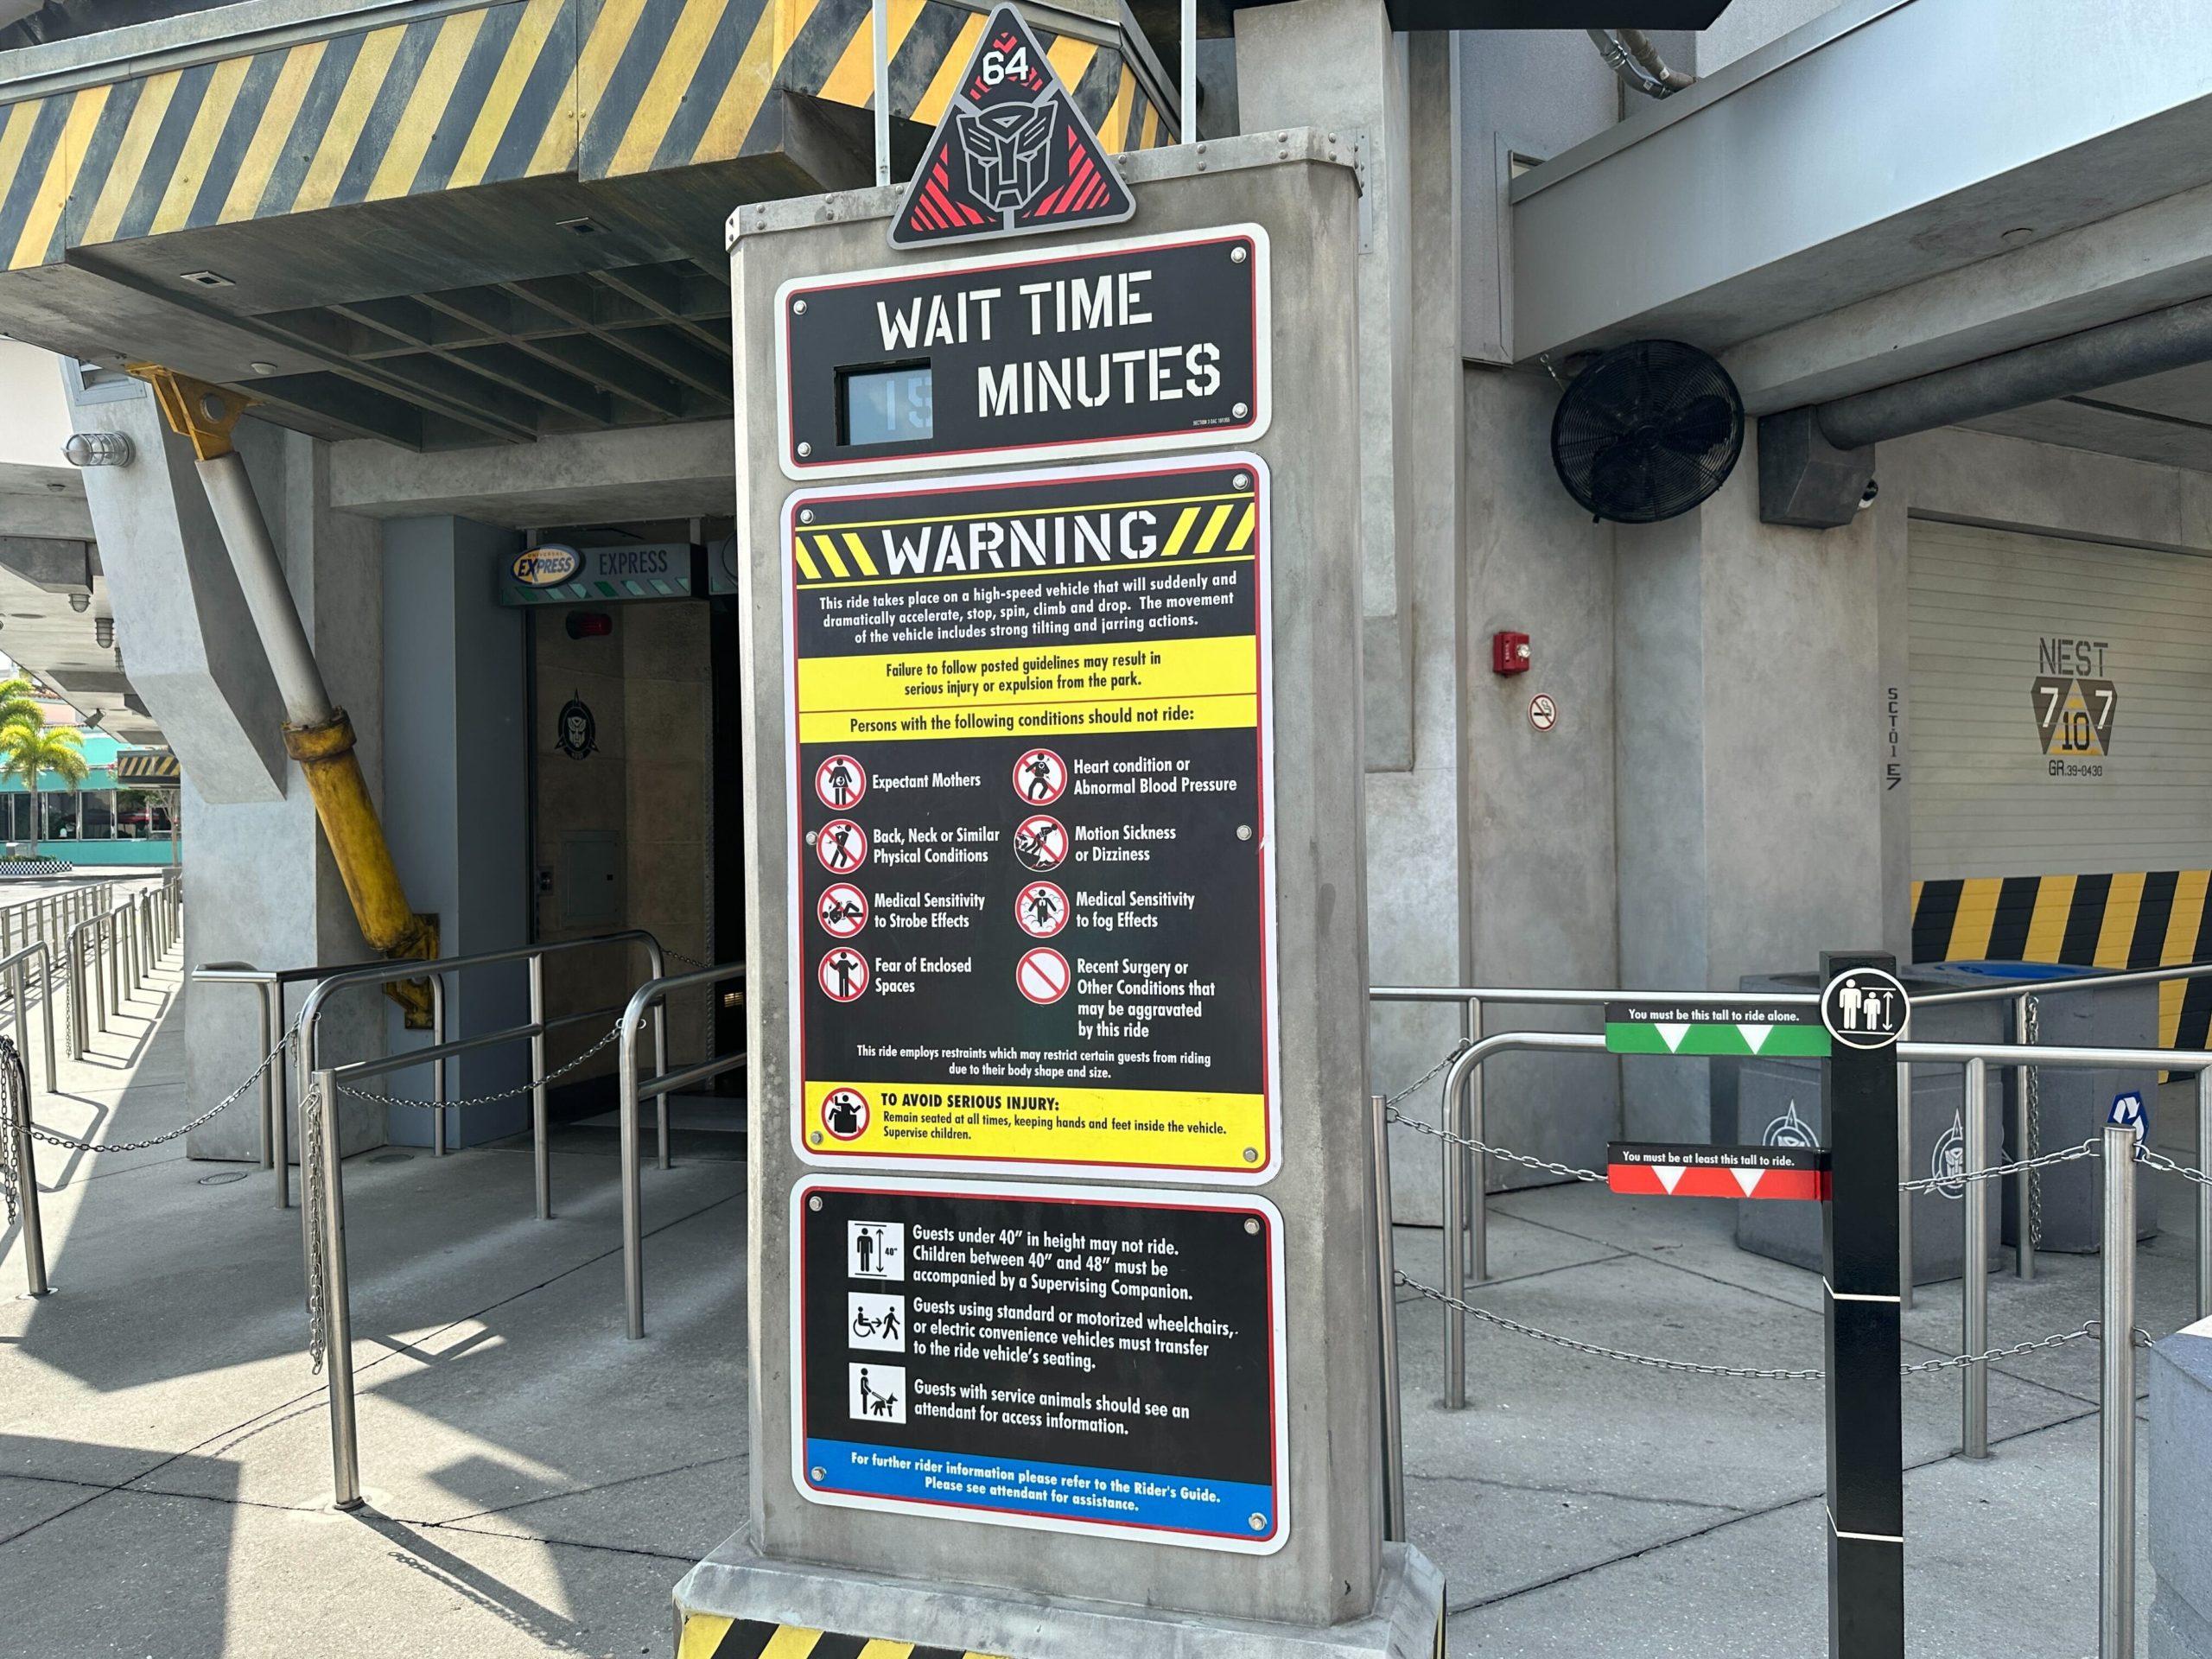
- TRANSFORMERS: The Ride 3D – 48 minutes, up 17
- Hogwarts Express – King’s Cross Station – 46 minutes, up 9
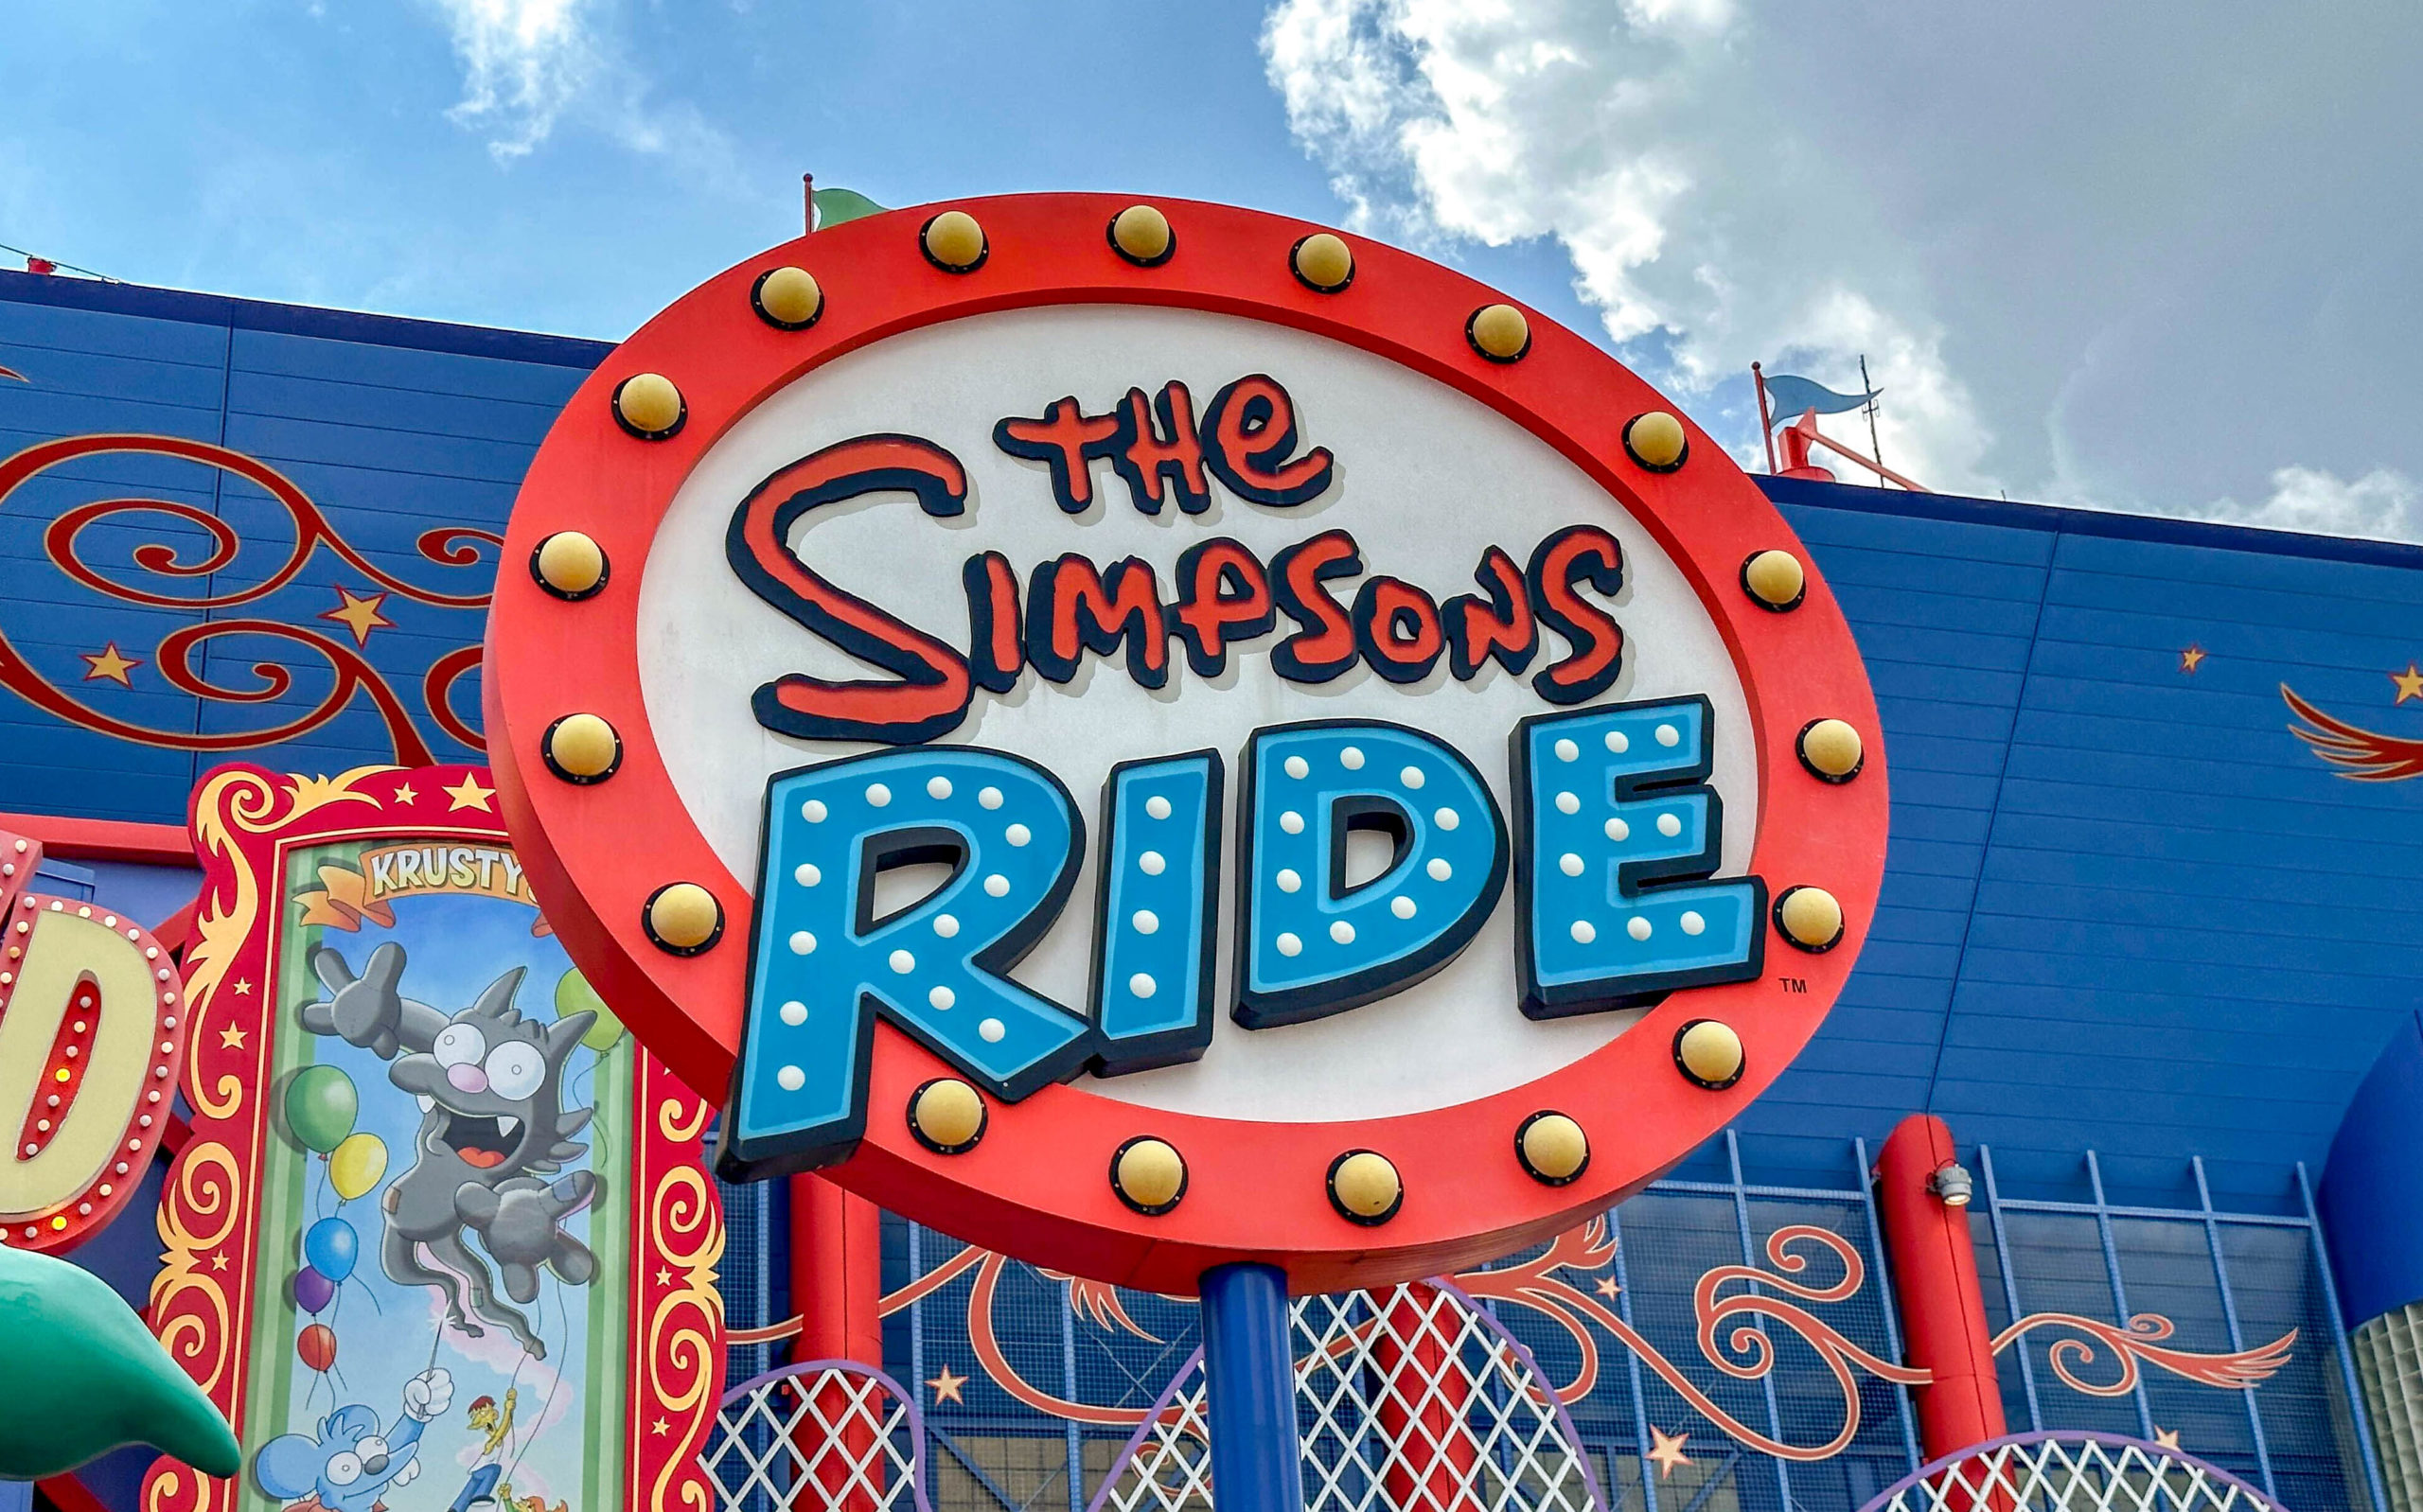
- The Simpsons Ride – 36 minutes, up 9
- E.T. Adventure – 35 minutes, up 5
- Trolls Trollercoaster – 32 minutes, up 10
- MEN IN BLACK Alien Attack! – 25 minutes, up 4
- Race Through New York Starring Jimmy Fallon – 24 minutes, up 1
- Kang & Kodos’ Twirl ‘n’ Hurl – 24 minutes, up 9
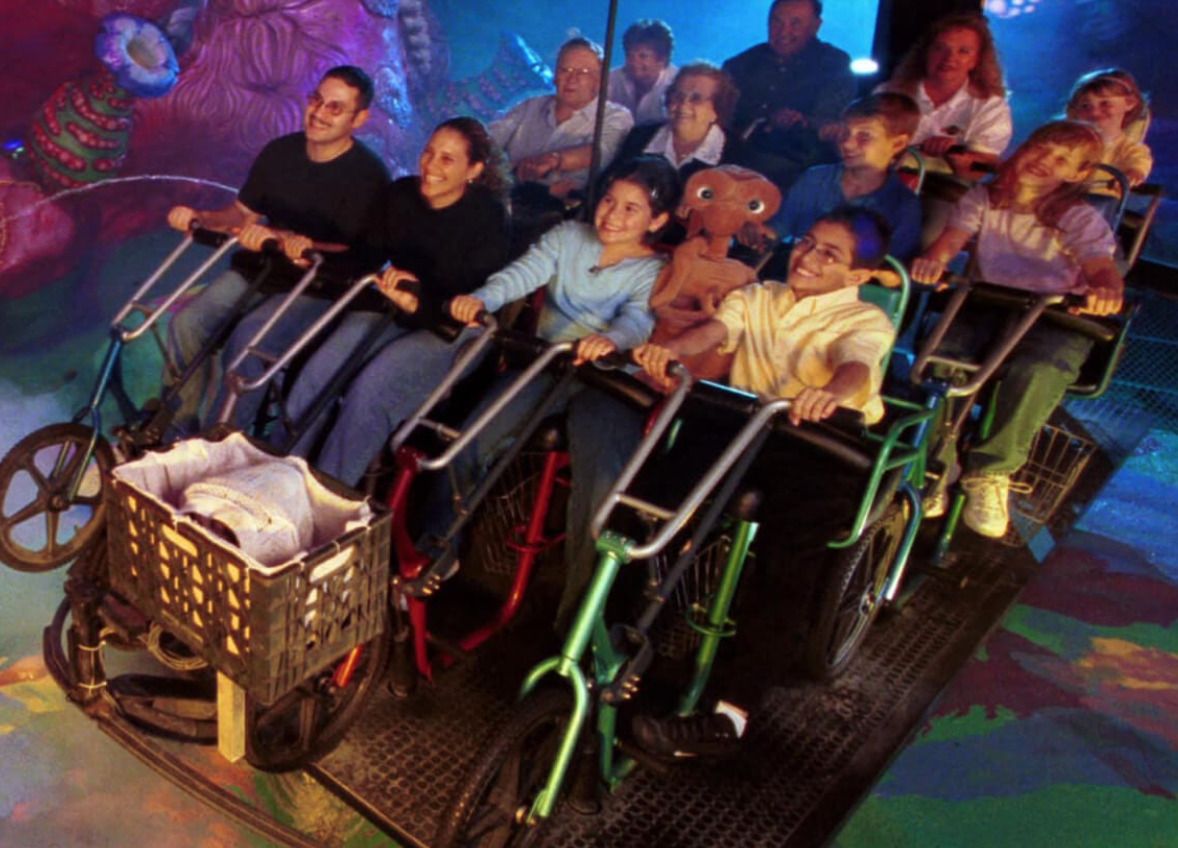
Photo: Universal
Overall, attractions at this park averaged a wait of 37 minutes, which is nine minutes more than last time.
Sure enough, Hogwarts Express behaved as expected at this park, and the entire place was more crowded due to HHN.
Universal’s Islands of Adventure
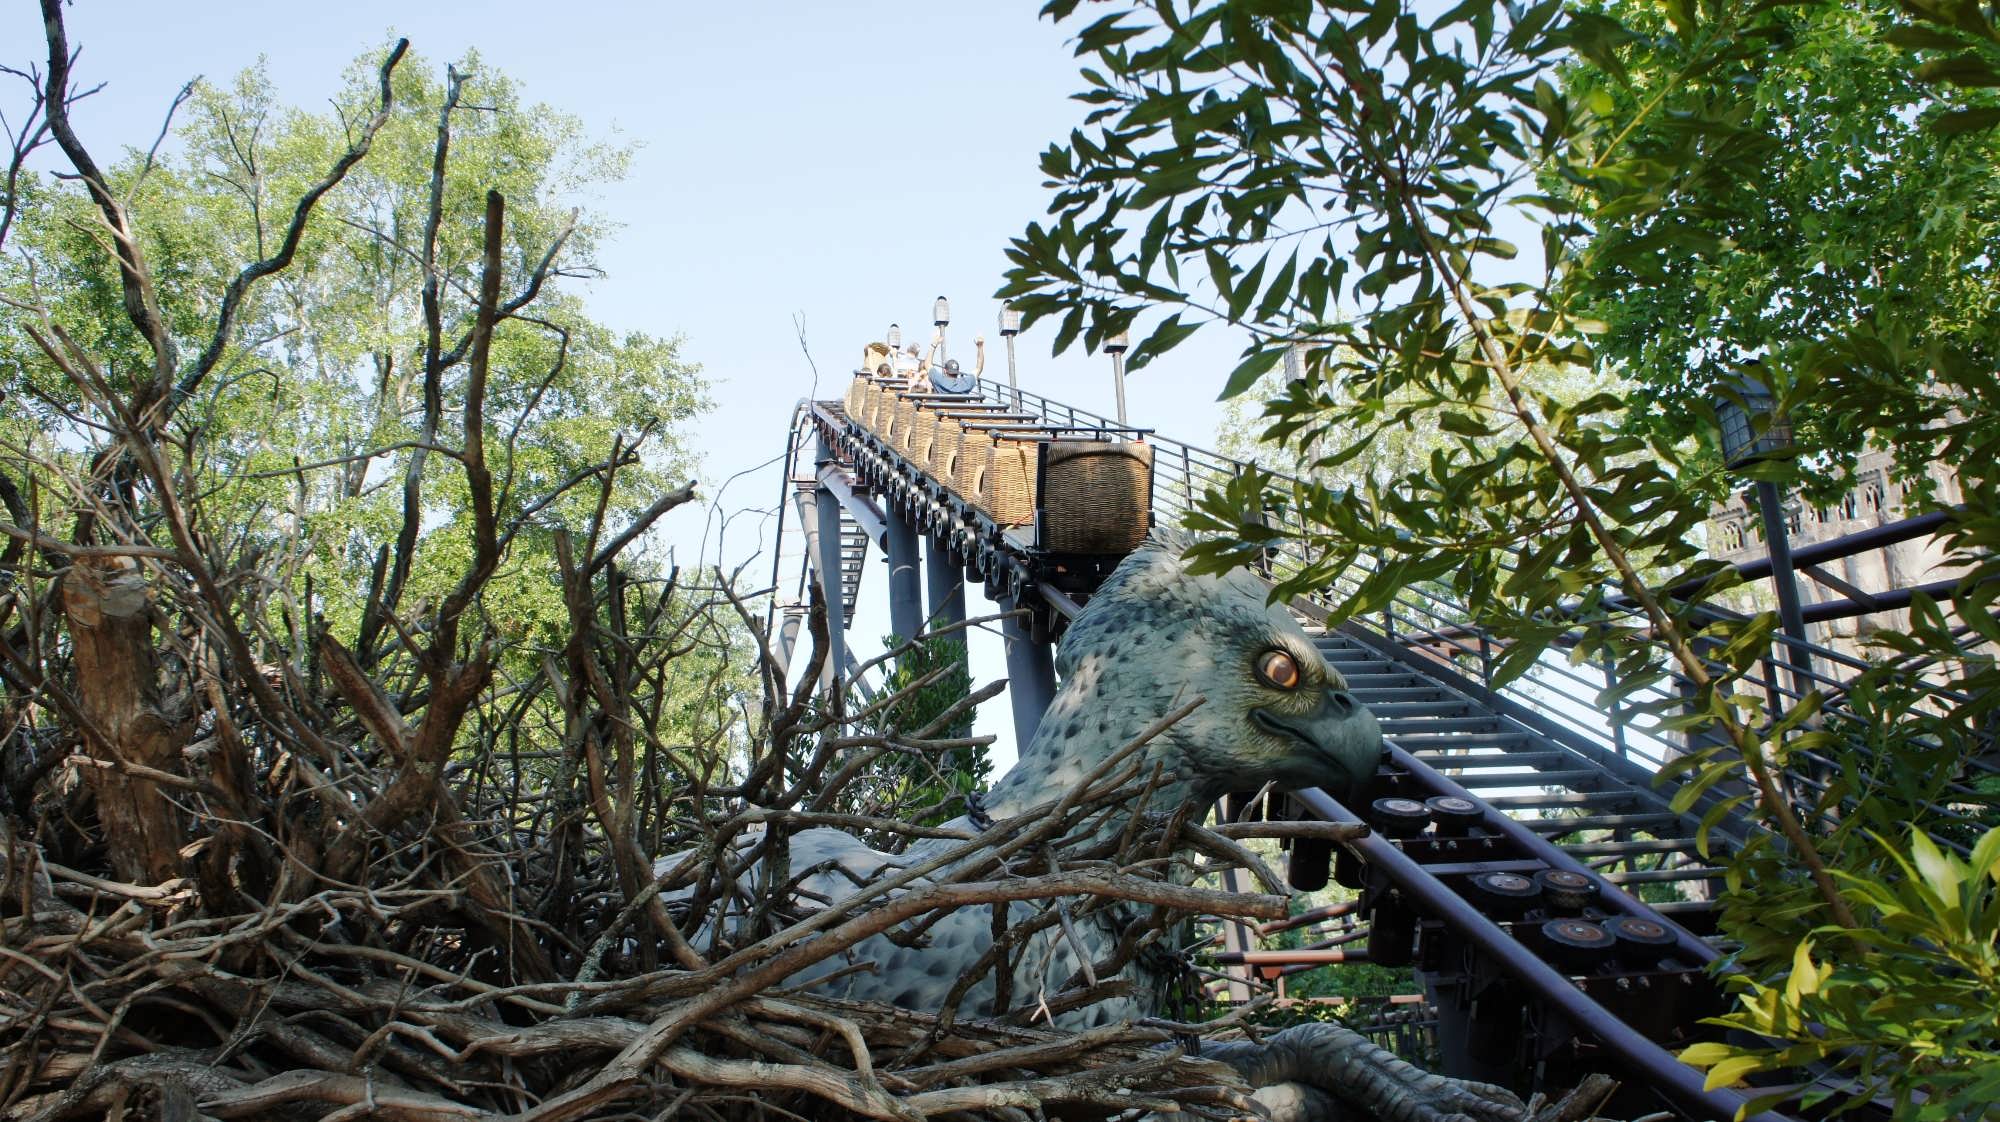
Photo: Orlando Informer
How does the October HHN rush impact Islands of Adventure? Here are the park’s average wait times last month:
- Hagrid’s Magical Creatures Motorbike Adventure – 98 minutes, up 18
- Jurassic World VelociCoaster – 63 minutes, up 16
- Flight of the Hippogriff – 46 minutes, up 9
- Harry Potter and the Forbidden Journey – 37 minutes, up 13
- The Incredible Hulk Coaster – 34 minutes, up 12
- Dudley Do-Right’s Ripsaw Falls – 29 minutes, down 4
- The Amazing Adventures of Spider-Man – 28 minutes, up 5
- Skull Island: Reign of Kong – 27 minutes, up 6
- Hogwarts Express – Hogsmeade Station – 24 minutes, up 6
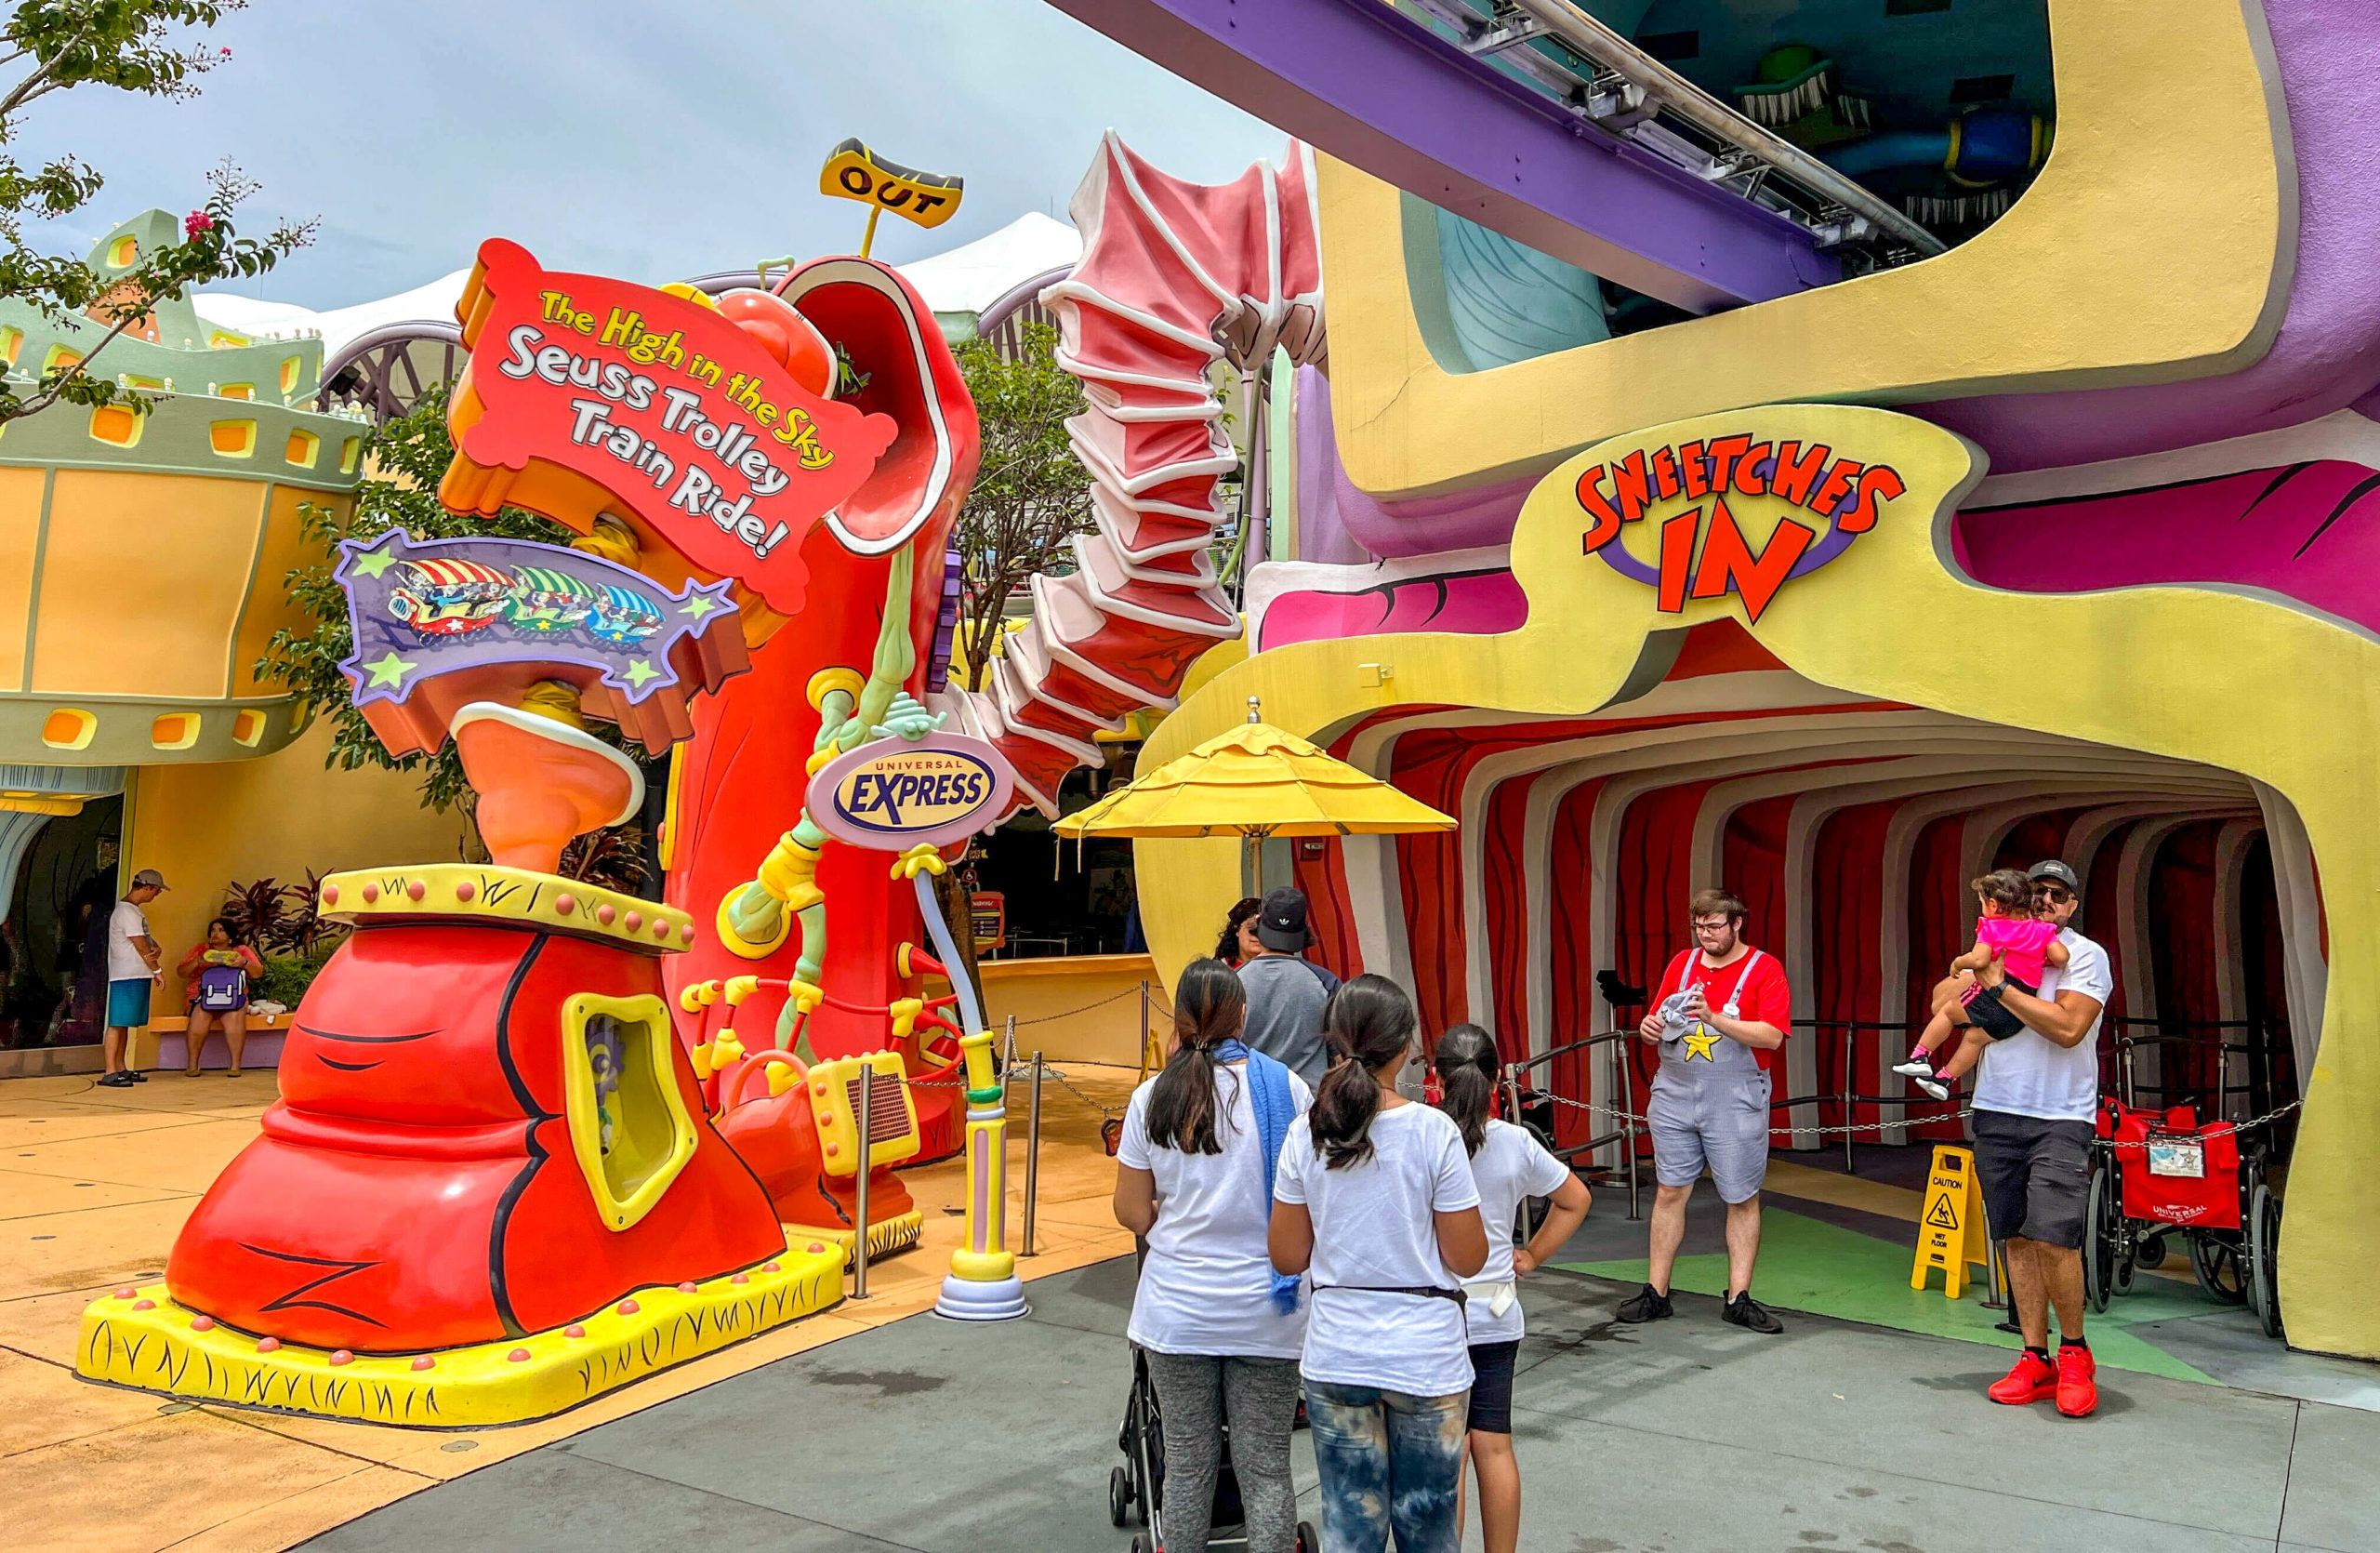
- The High in the Sky Seuss Trolley Train Ride – 20 minutes, up 6
- Jurassic Park River Adventure – 20 minutes, up 2
- Doctor Doom’s Fearfall – 18 minutes, up 2
- One Fish, Two Fish, Red Fish, Blue Fish – 15 minutes, up 5
- Popeye & Bluto’s Bilge-Rat Barges – 15 minutes, up 1
- The Cat in the Hat – 11 minutes, up 2
- Caro-Seuss-el – 9 minutes, up 1
- Storm Force Accelatron – 8 minutes, no change
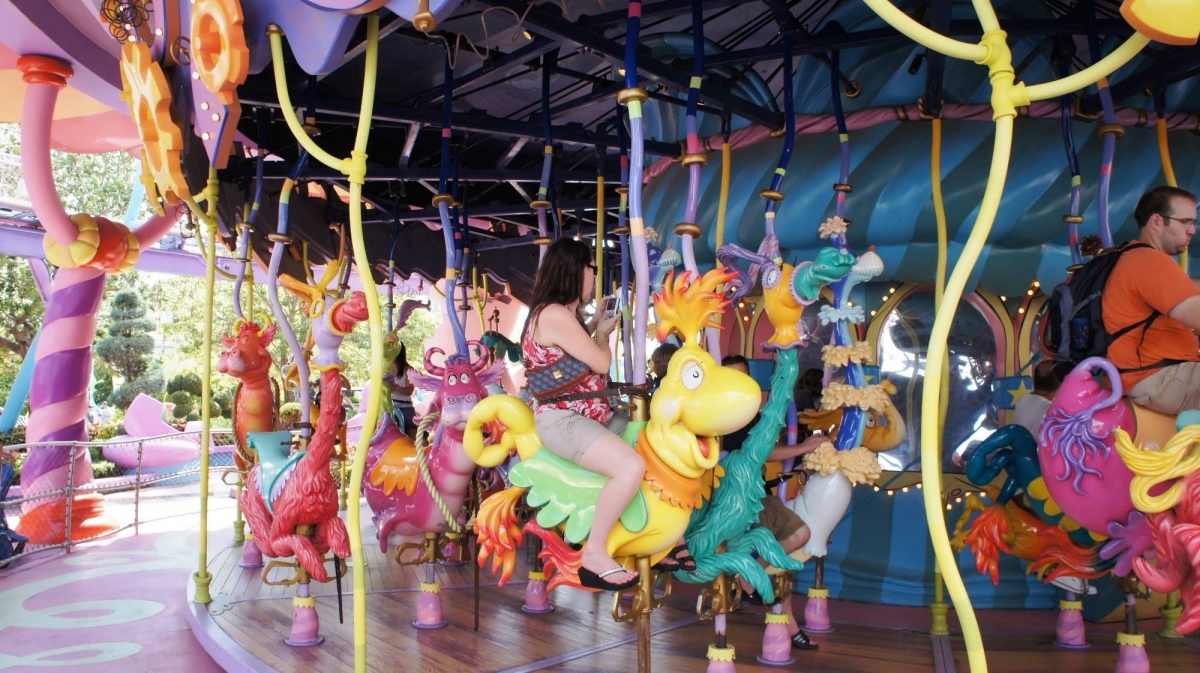
Photo: Orlando Informer
Overall, park guests waited for an average of 29 minutes, which is six minutes more than last time.
Final Thoughts

Photo: Universal
So, the parks were up across the board, with most attractions increasing their average waits, some of them by a significant amount.
Remarkably, that’s roughly the same as last year. During October 2023, USF averaged a wait of 37 minutes.
Meanwhile, Islands of Adventure averaged 32 minutes per attraction.
Given the overall lackluster attendance at Universal this year, the current data indicates one simple truth.

Source: Orlando Informer
No matter what else is going on with Universal Studios, fans will always flock to the parks for Halloween Horror Nights.

Thanks for visiting UniversalParksBlog.com! Want to go to Universal? For a FREE quote on your next Universal vacation, please fill out the form below and one of the agents from Let’s Adventure Travel will be in touch soon!
Feature Photo: Universal

