Universal Studios Wait Times for May 3rd, 2026

A year ago today, we all excitedly anticipated Universal’s Epic Universe.
Sure, a few lucky souls had already visited the park, but not many could say that.

Today Show
The rest of us were left waiting for the new theme park’s official opening day.
Meanwhile, the other two Universal Studios theme parks in Orlando languished a bit.
Attractions Magazine
Fans thought, “Why go now when Epic Universe will be open soon?”
Has anything changed in a year? Let’s find out.

Universal
Here are the Universal Studios wait times for May 2026.
Universal Studios Florida – The Big Three
(Jeff Fusco/Comcast via AP Images)
In case you missed it, Comcast just reported its quarterly earnings.
The corporate owner of NBCUniversal suffered another sluggish quarter.

Photo: Comcast NBC Universal
Notably, Comcast highlighted the many achievements of Epic Universe.
Overall, Universal Studios’ revenue is up considerably. There’s a but, though.

Photo: Getty
The expectation was that the new theme park would drive overall attendance.
Once we compare apples to apples, Universal’s revenue only increased seven percent year-over-year.

Photo:skillastics.com
That is NOT a lot of bonus money for a company that just added a new park.
Meanwhile, as I mentioned last time, attendance has been flagging at other parks.

Photo:universal
Universal’s other two Orlando parks aren’t receiving the expected boosts.
If anything, fans seem to be overlooking them in favor of the new hotness.
![]()
Did that trend change this past month? Well, this one’s pretty in the eye of the beholder.
Among the top three rides at Universal Studios Florida, we have a clear favorite.

Photo: Universal
Harry Potter and the Escape from Gringotts averaged a 51-minute wait.
That’s…five minutes less than last time. Uh oh. How about the other two?
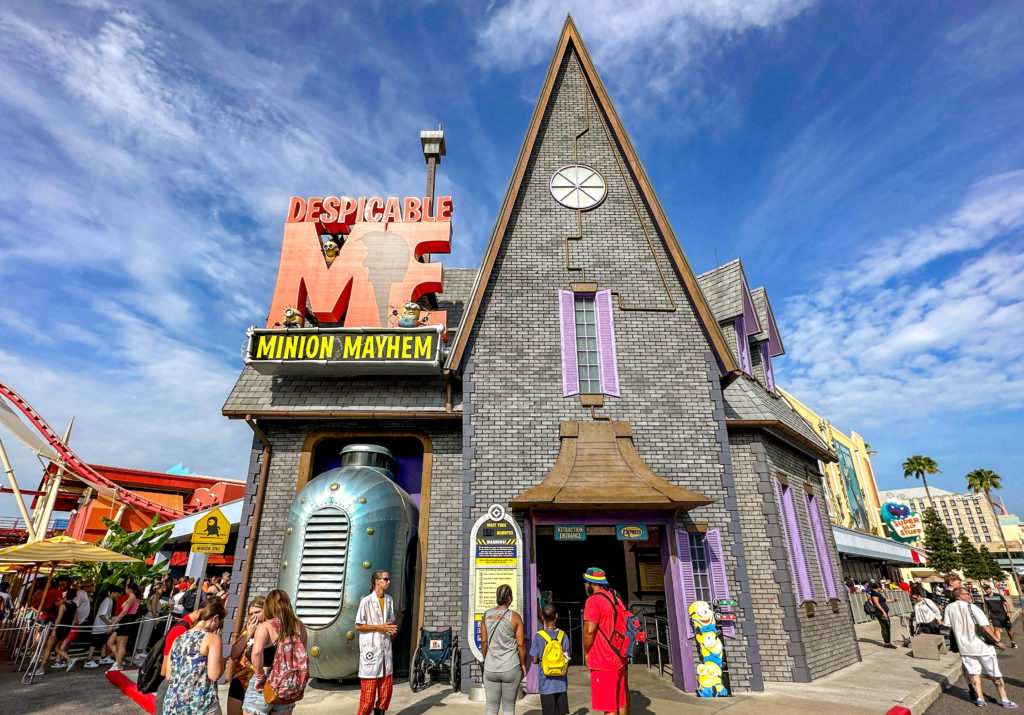
Minion Mayhem
Well, Despicable Me Minion Mayhem had a wait of 41 minutes.
That’s actually four minutes more than the previous month.

Then, we have Revenge of the Mummy, which had a 39-minute wait.
That’s three minutes less than last time, suggesting a slight downward trend. Still, that’s just three rides from a vibrant theme park. Let’s not draw conclusions yet.
Universal Studios Florida – Everything Else

Photo: Universal
Here are the other average wait times at Universal Studios Florida last month:
- TRANSFORMERS: The Ride – 3D – 33 minutes, up 2
- Hogwarts Express – King’s Cross Station – 29 minutes, up 2
- T. Adventure – 28 minutes, down 1
- The Simpsons Ride – 27 minutes, up 3
- MEN IN BLACK Alien Attack! – 21 minutes, down 1
- Trolls Trollercoaster – 21 minutes, up 2
- Fast & Furious – Supercharged – 20 minutes, up 3
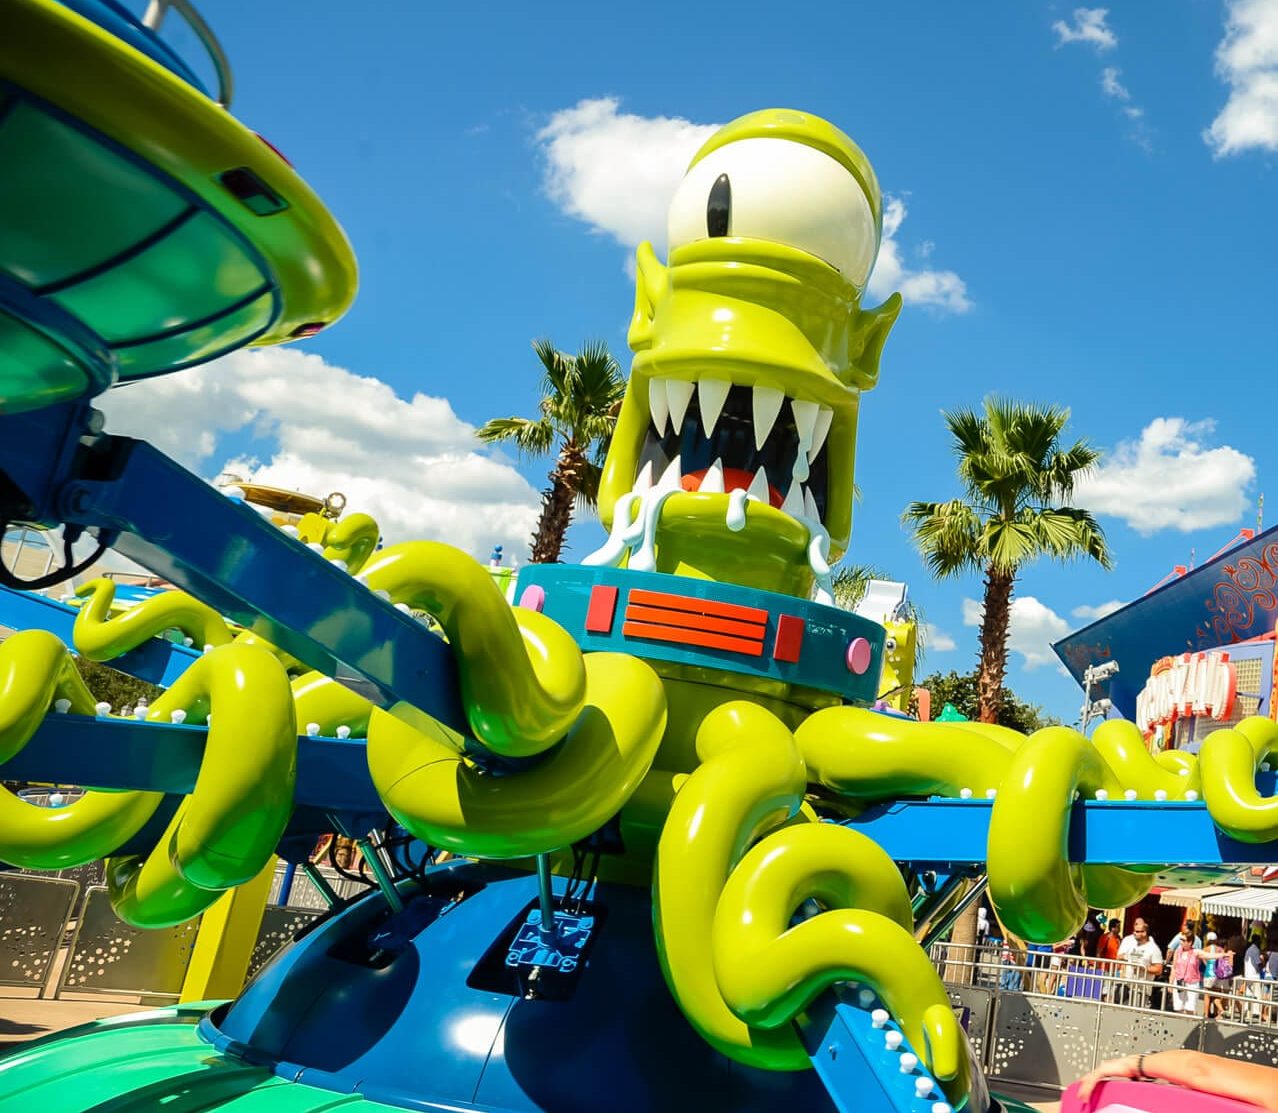
- Kang & Kodos’ Twirl ‘n’ Hurl – 20 minutes, up 2
- Race Through New York Starring Jimmy Fallon – 17 minutes, no change
- Illumination’s Villain-Con Minion Blast – 13 minutes, up 2
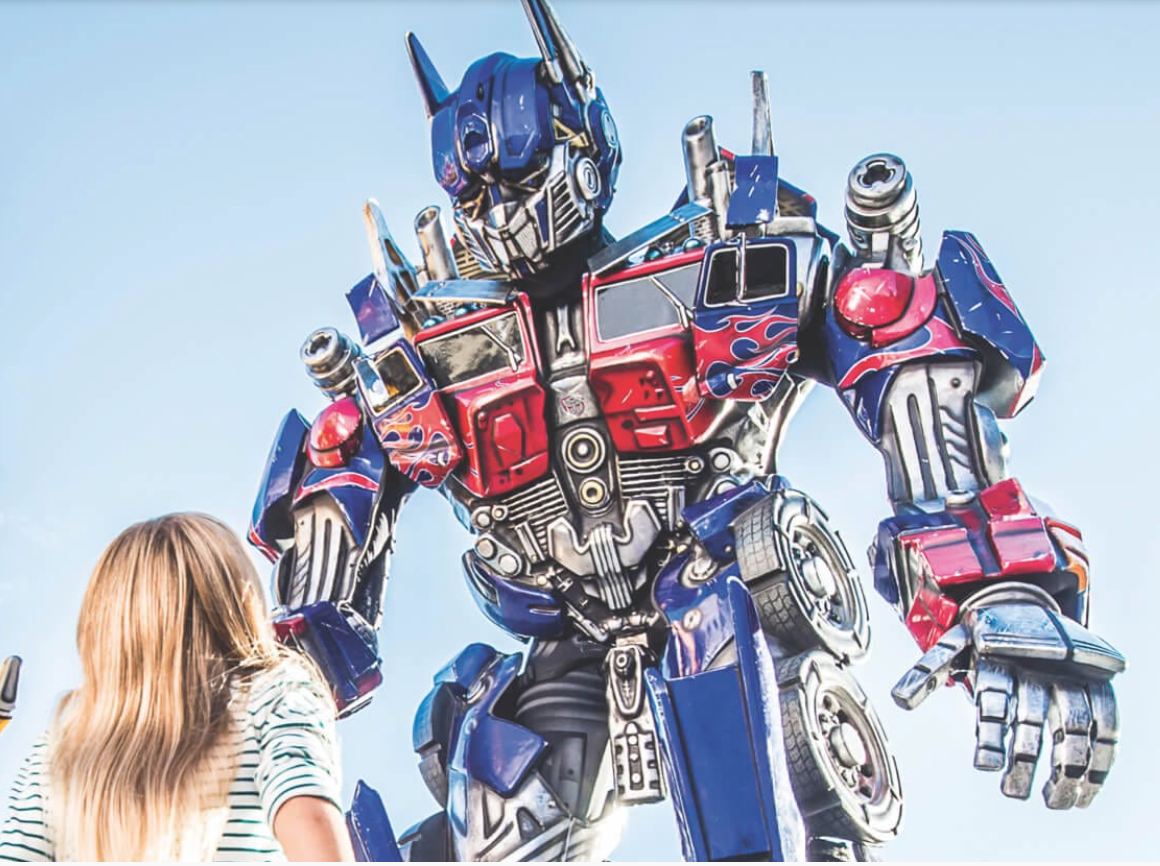
Photo: UNIVERSAL ORLANDO
Overall, park guests stood in line for an average of 28 minutes per attraction.
That’s a modest one-minute increase from last time.
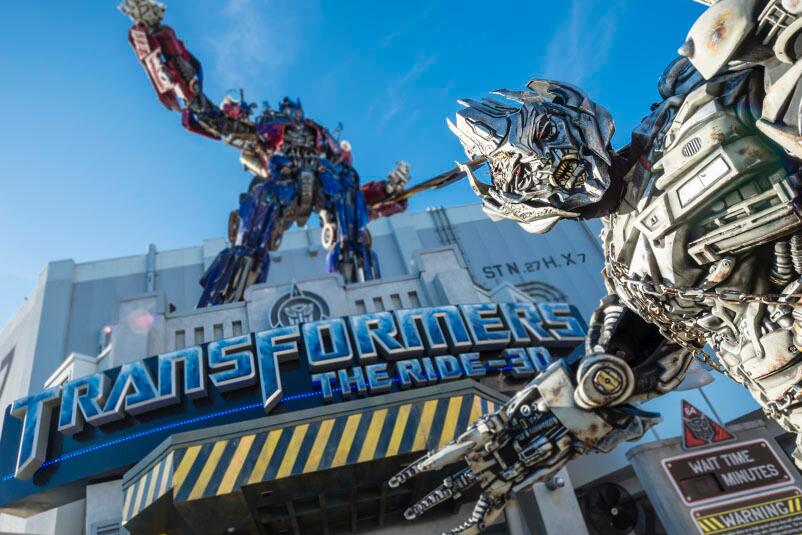
Image Credit: Universal Orlando
With Easter Week falling in April this year, that’s a bit unexpected.
Both parks should be up several minutes per attraction from last time.
Of course, this is a single park, which means we should withhold judgment for now.
Universal’s Islands of Adventure

Photo: Thrillist.com
Did Islands of Adventure do any better? Let’s find out.
Here are the park’s average wait times over the past month:
- Hagrid’s Magical Creatures Motorbike Adventure – 123 minutes, up 2
- Jurassic World VelociCoaster – 64 minutes, down 9
- Flight of the Hippogriff – 39 minutes, down 6
- The Amazing Adventures of Spider-Man – 38 minutes, down 1
- The Incredible Hulk Coaster – 37 minutes, down 2
- Dudley Do-Right’s Ripsaw Falls – 36 minutes, up 9
- Hogwarts Express – Hogsmeade Station – 34 minutes, down 3
- Skull Island: Reign of Kong – 34 minutes, down 3
- Harry Potter and the Forbidden Journey – 31 minutes, down 2
- The High in the Sky Seuss Trolley Train Ride – 24 minutes, up 1
- Doctor’s Doom Fearfall – 23 minutes, no change
- One Fish, Two Fish, Red Fish, Blue Fish – 23 minutes, no change
- Popeye & Bluto’s Bilge-Rat Barges – 15 minutes, up 4
- The Cat in the Hat – 14 minutes, down 1
- Storm Force Accelatron – 11 minutes, up 1
- Caro-Seuss-el – 10 minutes, no change

Photo: NBC via Getty Images
Overall, park guests spent an average of 35 minutes per attraction.
That’s the same as last time. So, Universal Studios looked eerily similar last month.
Final Thoughts
The good news is that March featured more Spring Break weeks than April. However, Easter Week alone should have powered the parks to big numbers.

Universal
On the one hand, it’s great that guests didn’t wait long per attraction last month.
On the other hand, Universal Orlando Resort’s older parks aren’t getting the expected boost.

With Epic Universe open nearly a year now, the honeymoon phase has ended.
At this point, I think it’s fair to say that normalcy has returned to the parks.

NBC
Also – and it bums me out to say this – Epic’s halo effect on the other parks appears overblown.
![]()
Thanks for visiting UniversalParksBlog.com! Want to go to Universal? For a FREE quote on your next Universal vacation, please fill out the form below and one of the agents from Let’s Adventure Travel will be in touch soon! Thank you!
Feature Photo: Universal