Universal Studios Wait Times for September 2023
Your favorite time of the year has arrived!
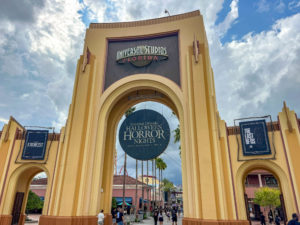
By the time you read this, Halloween Horror Nights 2023 will draw massive crowds to Universal Orlando Resort.
Before that happens, let’s examine how many people visited the parks last month.
Here are the average wait times at Universal Orlando Resort for the past 30 days!
Let’s Start with the New Attraction
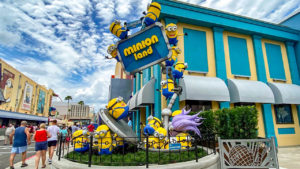
Minion Land
Friends, if you haven’t been keeping up, I’m happy to tell you that Minion Land has opened at Universal Studios Florida!
This new land takes over part of the space previously occupied by Shrek 4-D and other parts of the front of the park.
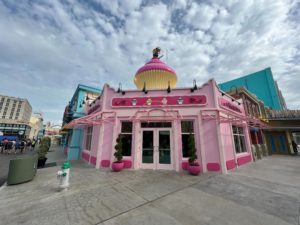
Remarkably, the opening of this themed land has not caused massive wait times at the newest attraction, though.
Universal officials intentionally chose to reboot the Shrek 4-D building with a moving sidewalk attraction.

The idea is like MEN IN BLACK Alien Attack!, with the difference that you don’t enter a ride cart. The floor moves beneath you instead.
So, the ride structure carries you to the various targets. This rotational design ensures absolutely huge throughput.
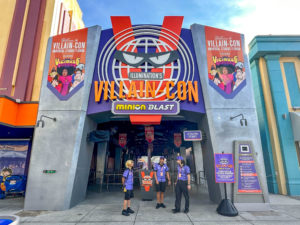
We can tell this from the data because Universal lists the attraction’s wait times on the app, something we weren’t sure whether to expect.
Illumination’s Villain-Con Minion Blast officially opened on August 11th.
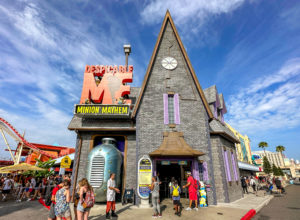
We have nearly three weeks of data here, and it’s quite impressive.
Guests stood in line for an average of 38 minutes to do some Minion Blast-ing.
Realistically, the first few weeks will require some of the longest waits ever for this attraction.
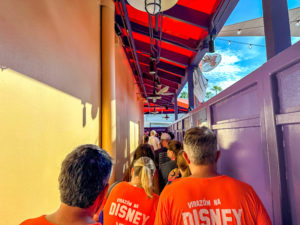
Villain-Con Minion Blast
If we’re starting under 40 minutes, Minion Blast will rarely require a long wait, even during the most crowded times of the year.
This new ride looks like it’ll save guests AND help the overall wait times at Universal Studios Florida for the foreseeable future!
Universal Studios Florida — The Big Four

Photo: Universal Orlando
In another month or two, I’ll switch this section to the Big Five. Villain-Con deserves a standalone entry at the start, though.
Notably, the arrival of Minion Blast has caused at least one ripple effect among the previous Big Four, though.
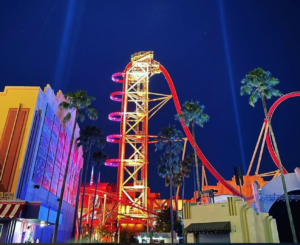
Photo:instagram/universalorlando
The average wait for Hollywood Rip Rockit fell from 43 minutes to 30 minutes.
If you’re familiar with the park’s design, you smile knowingly at this fact.
Minion Land has undeniably attracted traffic away from the surrounding area.
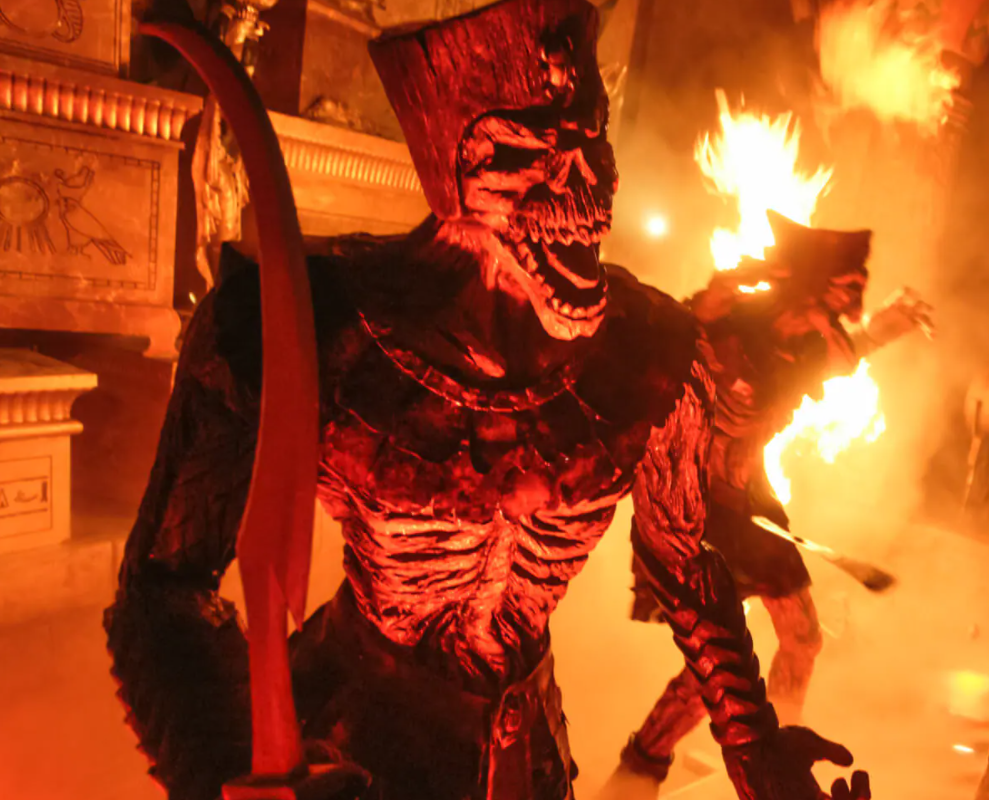
Photo: Universal
As proof, Revenge of the Mummy fell to an average wait of 34 minutes, which is nine minutes or 21 percent less than the previous month.
The other two members of the Big Four also suffered this month.

Photo: Universal
Harry Potter and the Escape from Gringotts dropped to 46 minutes, eight minutes less than time.
None of this behavior should surprise you. Guests spent a disproportionate amount of time at Minion Land last month.
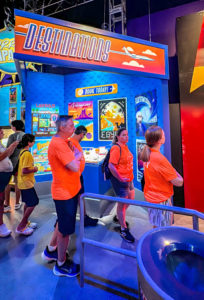
The one point I’ll make here is that this themed land remained in technical rehearsals for the first ten days.
You might believe that Minion Land’s arrival would have siphoned even more traffic from the other rides if it’d been open the full month.
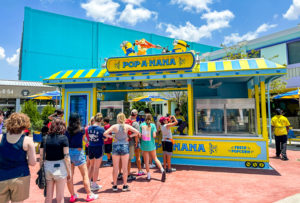
Objectively, I don’t believe that’s true because Minion Land WAS open in all ways but official proclamation.
Also, in a humorous twist, Minion Land didn’t negatively impact the wait time for Despicable Me: Minion Mayhem.
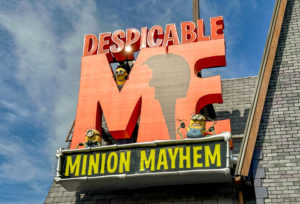
This attraction’s wait time decreased to 46 minutes, which is nine minutes less than last time.
Park guests were clearly laser-focused on the new stuff.
Universal Studios Florida – Everything Else
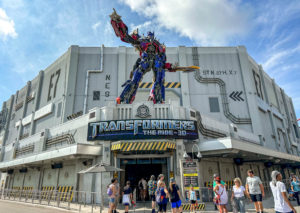
Here are the other average wait times at Universal Studios Florida last month:
- TRANSFORMERS: The Ride 3-D – 44 minutes, down 4
- T. Adventure – 34 minutes, up 4
- Fast & Furious – Supercharged – 32 minutes, down 9
- Hogwarts Express – King’s Cross Station – 31 minutes, no change
- The Simpsons Ride – 28 minutes, down 4
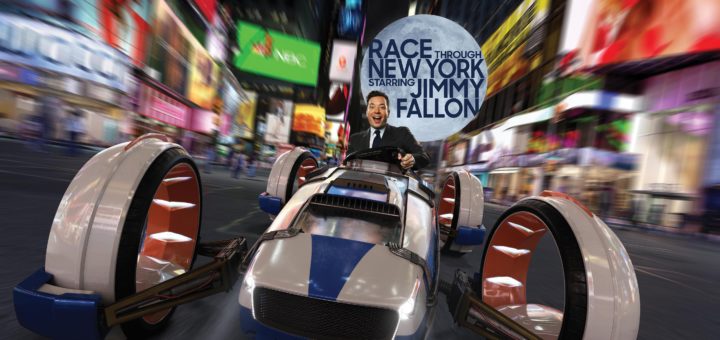
- Race Through New York Starring Jimmy Fallon – 26 minutes, down 4
- MEN IN BLACK Alien Attack! – 23 minutes, down 4
- Kang & Kodos’ Twirl ‘n’ Hurl – 18 minutes, down 5
Overall, park guests waited for an average of 33 minutes per attraction, which is five minutes less than the previous month.
Universal’s Islands of Adventure
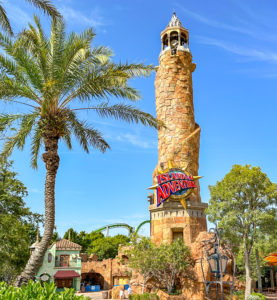
As the other park showed, attendance declined in August, which isn’t the least bit surprising.
As a general rule, July is one of the two (or lately three) most crowded months on the annual calendar.
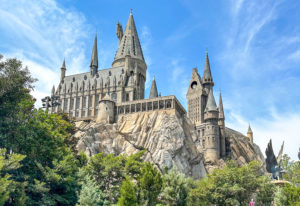
When summer vacation ends, theme parks experience attendance drops.
Typically, this behavioral change reduces wait times. Did it this past month? Let’s check.
- Hagrid’s Magical Creatures Motorbike Adventure – 76 minutes, down 9
- Dudley Do-Right’s Ripsaw Falls – 60 minutes, down 2
- Jurassic World VelociCoaster – 59 minutes, down 18
- Skull Island: Reign of Kong – 41 minutes, down 16
- Pteranodon Flyers – 38 minutes, down 2
- The Amazing Adventures of Spider-Man – 37 minutes, down 9
- The Incredible Hulk Coaster – 36 minutes, down 13
- Jurassic Park River Adventure – 35 minutes, down 6
- Harry Potter and the Forbidden Journey – 33 minutes, down 9
- Flight of the Hippogriff – 32 minutes, down 8
- The High in the Sky Seuss Trolley Train Ride! – 25 minutes, up 5
- Hogwarts Express – Hogsmeade Station – 23 minutes, down 2
- Popeye & Bluto’s Bilge-Rat Barges – 22 minutes, down 8
- Doom’s Fearfall – 16 minutes, down 3
- The Cat in the Hat – 13 minutes, down 2
- One Fish, Two Fish, Red Fish, Blue Fish – 13 minutes, down 7
- Storm Force Accelatron – 9 minutes, down 1
- Caro-Seuss-el – 8 minutes, down 1
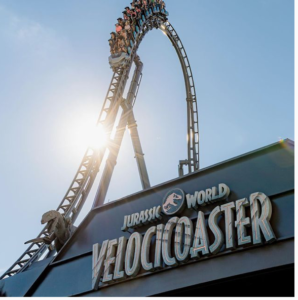
Photo:instagram/universalorlando
Overall, guests at Islands of Adventure stood in line for an average of 32 minutes per attraction. That’s a sizable seven minutes less than last month.
Summer is over, folks! But that’s exceptional news for Universal Studios fans! It means Halloween Horror Nights has arrived!

Thanks for visiting UniversalParksBlog.com! Want to go to Universal? For a FREE quote on your next Universal vacation, please fill out the form below and one of the agents from Let’s Adventure Travel will be in touch soon!

