Universal Orlando Resort Wait Times for August 2024
Comcast just dropped the bombshell that theme park attendance fell dramatically last quarter.
You’d probably guessed that if you’d been reading these wait times articles over the past few months.
While diehard Universal fans like you and I don’t believe in taking a break, casual tourists are more simplistic.
When word spreads that Universal Epic Universe will open in 2025, many vacationers choose to skip Universal vacations in 2024.
Photo: Universal Orlando
We’re witnessing that behavior with the data, as Universal Orlando Resort has definitely experienced a summer slowdown.
How severe was the drop? We’ll get some idea with the Universal Studios wait times for August 2024.
About Universal Studios Florida
(Jeff Fusco/Comcast via AP Images)
As I discussed the other day, NBCUniversal’s theme park revenue fell by 10.6 percent, while EBITDA dropped more than 24 percent.
Comcast, the corporate owner of NBCUniversal, attributed many of those losses to Universal Orlando Resort (UOR).

Photo: Comcast NBC Universal
So, we know that theme park attendance wasn’t great, although Comcast’s President suggested it was a “normalization.”
To an extent, that’s accurate, as the so-called “Revenge Travel” era triggered a tourism boom.

Photo: Universal
The entire affair was akin to a psychological op. Any parent will tell you that if they say a child cannot do something, the kid will want it more than anything.
That same logic applied to tourists during the pandemic. We were told that we couldn’t leave the house.

Image Source: Universal
Therefore, as soon as consumers felt safe to do so, they flocked to tourist destinations, with UOR benefiting greatly.
Now that this temporary phenomenon has dissipated gradually over the last three years, normalcy has returned to an extent.

Photo: Universal
So, Universal’s current struggles are both temporary in nature and easily predictable with the benefit of hindsight.
We’ve seen it in the data throughout 2024, and we’ll probably notice it again for July, which historically has been the most popular month.
Universal Studios Florida – The Big Five
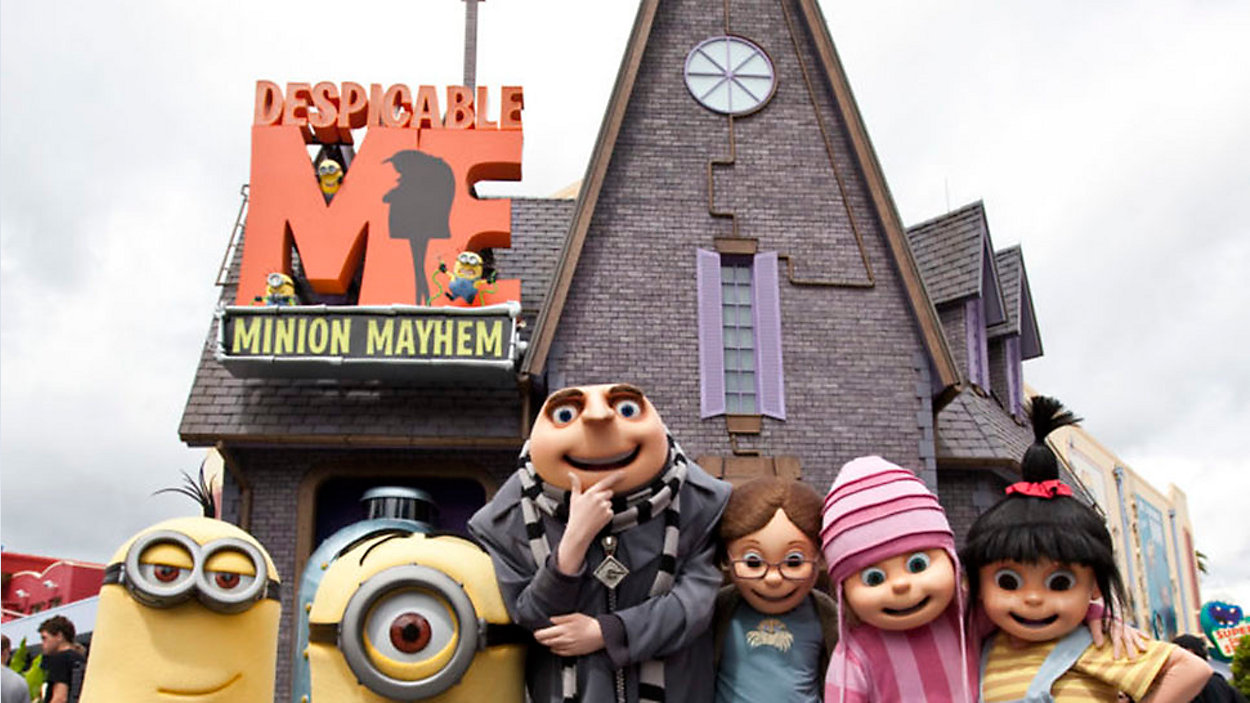
Photo: Universal
Evaluating Universal’s Big Five, here’s what we learn. Despicable Me Minion Mayhem had an average wait of 52 minutes.
That’s eight minutes more than last time, but we still don’t have anything with an oppressively long wait at Universal Studios Florida.

To wit, the other Minions ride, Illumination’s Villain-Con Minion Blast, averaged a modest wait of 25 minutes, an increase of seven minutes.
Next was Revenge of the Mummy, with a 46-minute wait. It increased by six minutes, indicating that the Big Five were up a bit this past month.

Photo: Universal
As a reminder, I call this August wait times, but we’re evaluating data from July. And that month appears to be more crowded than June.
To wit, Harry Potter and the Escape from Gringotts averaged a 45-minute wait, which was four minutes more than last time.
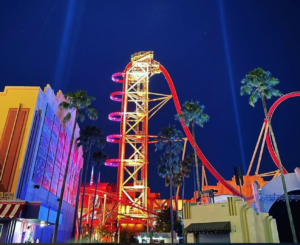
Photo:instagram/universalorlando
Finally, Hollywood Rip Ride Rockit remained steady this summer, averaging a 33-minute wait in July, one minute more than during June.
Universal Studios Florida – Everything Else
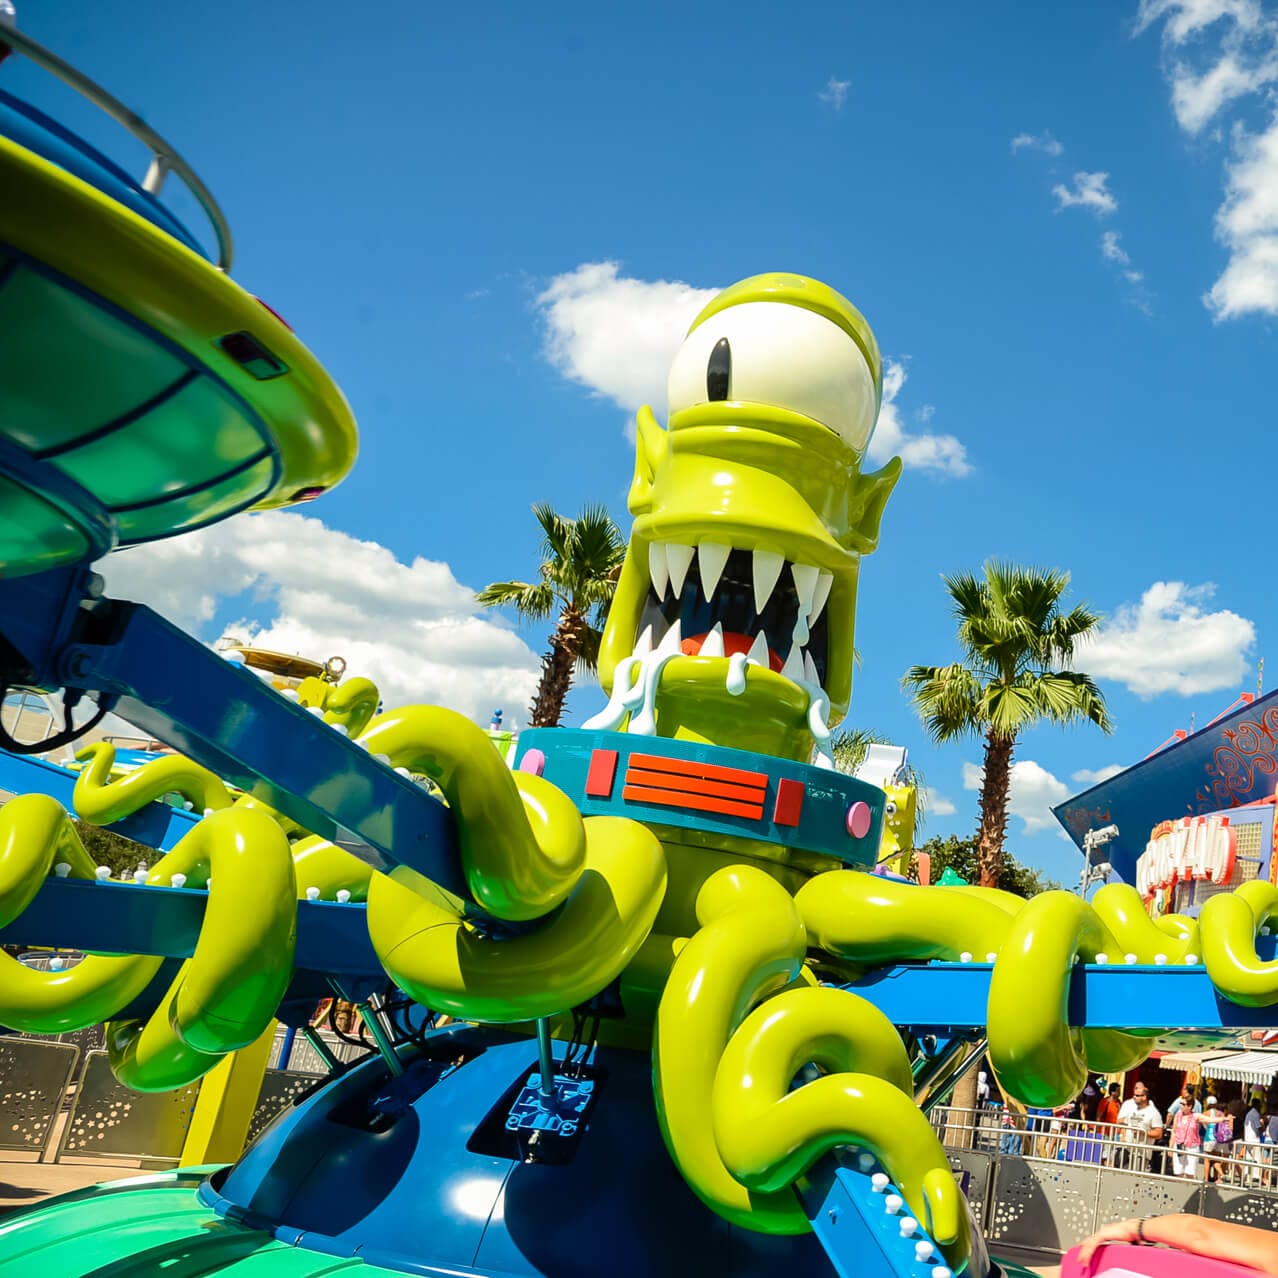
Photo: Universal
Here are Universal Studios Florida’s other average wait times last month.
- TRANSFORMERS: The Ride 3D – 41 minutes, up 4
- Trolls Trollercoaster – 34 minutes, up 3
- The Simpsons Ride – 33 minutes, no change
- T. Adventure – 32 minutes, down 1
- Hogwarts Express – King’s Cross Station – 32 minutes, down 1
- Race Through New York Starring Jimmy Fallon – 32 minutes, down 2
- MEN IN BLACK Alien Attack! – 25 minutes, up 1
- Fast & Furious – Supercharged – 23 minutes, up 2
- Kang & Kodos’ Twirl ‘n’ Hurl – 22 minutes, up 2

Photo: USA Today
Overall, guests at Universal Studios Florida stood in line for an average of 34 minutes per attraction.
That’s two minutes more than guests waited for rides in June. So, the park increased a bit.

Photo:universal
However, for comparison, the same attractions averaged a wait of 38 minutes in July 2023 and 48 minutes in July 2022.
The data tells a lot of the story there, with this park requiring 50 percent longer waits just two years ago.
Universal’s Islands of Adventure
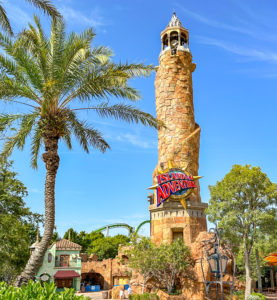
I suspect the same phenomenon is occurring at Islands of Adventure. So, here are the park’s average wait times to verify.
- Hagrid’s Magical Creatures Motorbike Adventure – 88 minutes, down 1
- Jurassic World VelociCoaster – 73 minutes, up 13
- Dudley Do-Right’s Ripsaw Falls – 70 minutes, up 14
- The Amazing Adventures of Spider-Man – 42 minutes, up 5
- Flight of the Hippogriff – 39 minutes, up 3
- Jurassic Park River Adventure – 39 minutes, up 11
- The Incredible Hulk Coaster – 37 minutes, up 1
- Harry Potter & the Forbidden Journey – 35 minutes, up 5
- Skull Island: Reign of Kong – 35 minutes, up 1
- Popeye & Bluto’s Bilge-Rat Barges – 28 minutes, up 6
- Hogwarts Express – Hogsmeade Station – 25 minutes, down 2
- One Fish, Two Fish, Red Fish, Blue Fish – 18 minutes, no change
- The High in the Sky Seuss Trolley Train Ride! – 17 minutes, down 1
- Doctor Doom’s Fearfall – 16 minutes, no change
- The Cat in the Hat – 13 minutes, up 1
- Storm Force Accelatron – 8 minutes, down 1
- Caro-Seuss-el – 7 minutes, down 1

Overall, guests at Islands of Adventure stood in line for an average of 34 minutes per attraction.
That’s three minutes more than the same timeframe in June. However, it’s a drop from 39 minutes in July 2023.
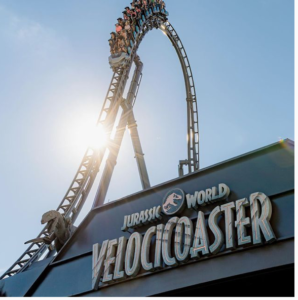
Photo:instagram/universalorlando
In July 2022, the average wait was 43 minutes. So, we can definitely identify a slippage in attendance this summer.

Thanks for visiting UniversalParksBlog.com! Want to go to Universal? For a FREE quote on your next Universal vacation, please fill out the form below and one of the agents from Let’s Adventure Travel will be in touch soon!
Feature Photo: Universal

