Universal Studios Wait Times for July 2024
Another month is in the books, which places us one step closer to the opening of Universal Epic Universe.
As previously discussed, casual tourists are skipping a summer theme park visit in anticipation of next year’s debut.

Photo:universal
To sweeten the pot, Universal added some limited-time events for the summer of 2024.
How did those enhancements impact the crowds? Here are Universal Studios’ average wait times for July 2024.
Universal Studios Florida – The Big Five
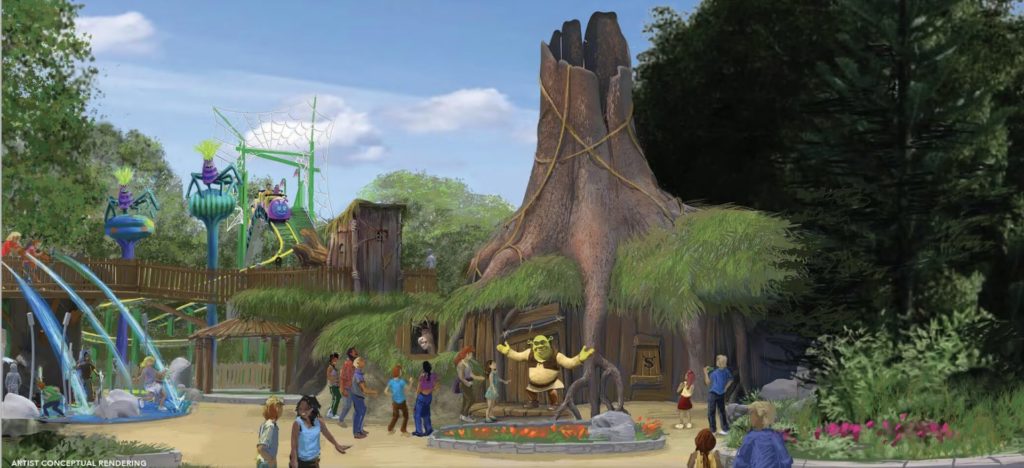
The first thing to know about Universal Studios Florida is that the park has undergone some dramatic changes.
Over the past month, DreamWorks Land has opened to the public.

Universal
While none of the experiences here will factor into the park’s longest waits, they do have a subtle impact overall.
With guests having more experiences, they split their time among the new offerings.
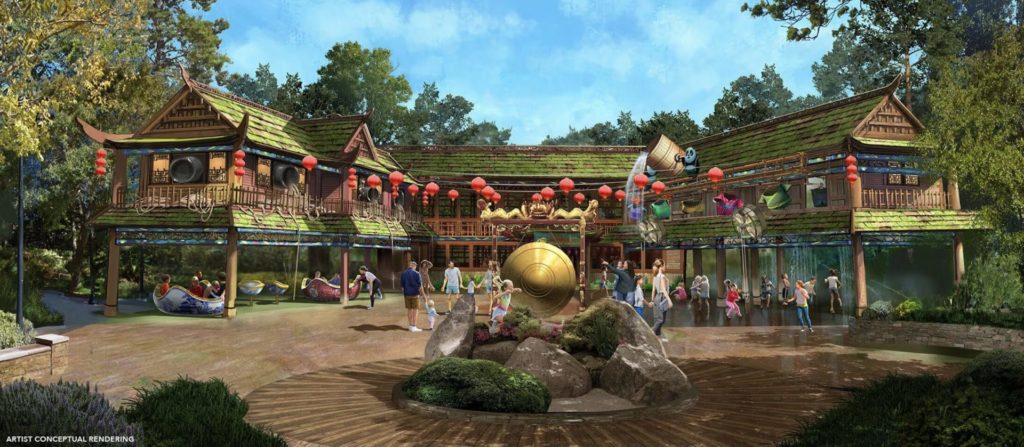
Photo: Universal
Also, since the DreamWorks Land stuff is all new, it’s more exciting to guests. They want to see what’s been added.
Conversely, more guests are likely to visit the park during the opening days of DreamWorks Land.
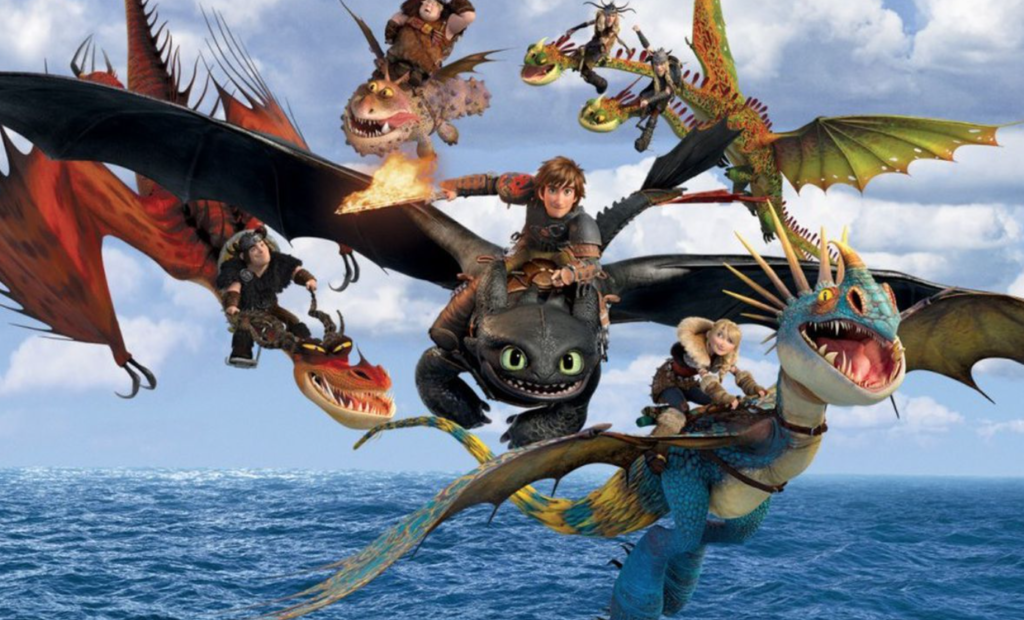
Photo: dreamworks
Sure, we’re discussing a minor addition, as it’s just a re-theming of existing space, but DreamWorks is much more popular.
So, people want to try all the new stuff. How did all these various factors impact the wait times?
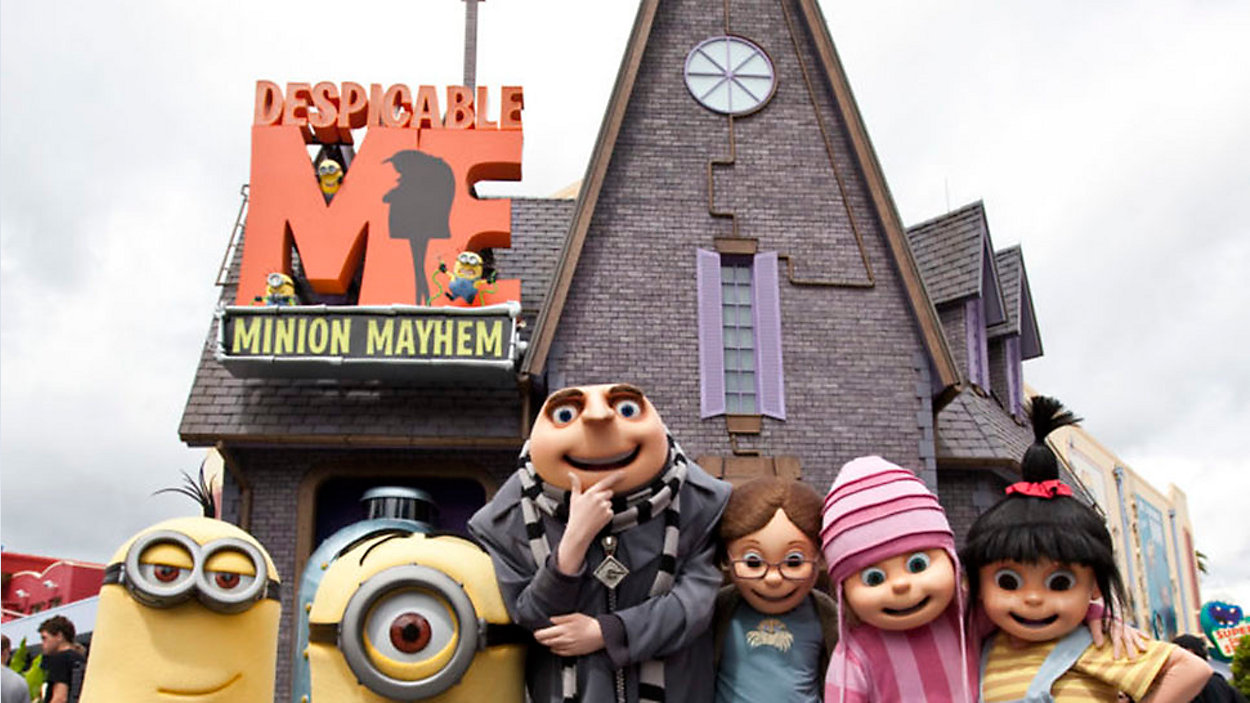
Photo: Universal
Well, the longest wait at the park was Despicable Me Minion Mayhem.
Guests stood in line for 44 minutes, four minutes longer than last time.

Meanwhile, Illumination’s Villain-Con Minion Blast also increased from 15 minutes in May to 18 minutes in June.
As a reminder, despite the article’s name, we’re looking back at June since we can’t possibly know July’s wait times yet.
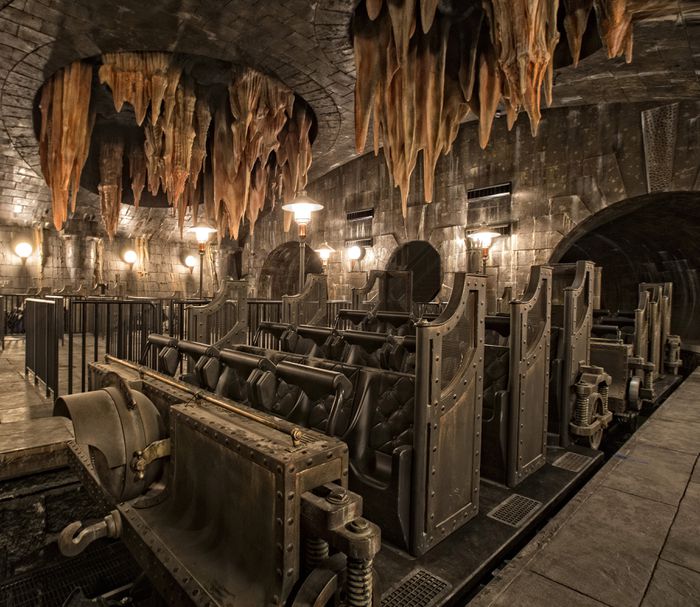
Photo: Universal
After that, we have the park’s alpha, Harry Potter and the Escape from Gringotts. The combo ride had a 41-minute wait, one more than last time.
The next most popular attraction was Revenge of the Mummy, which averaged a 40-minute wait.
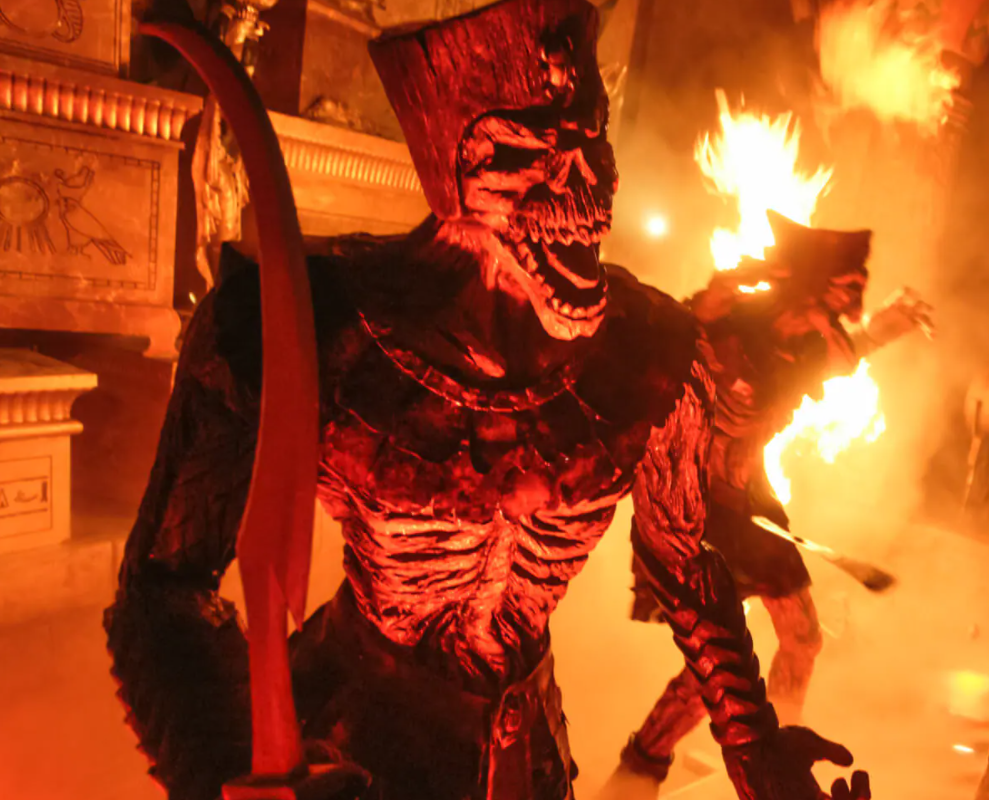
Photo: Universal
That’s nearly identical to last month’s 42-minute wait. It also reflects that more guests were in attendance than thrill riders.
That’s probably the DreamWorks Land effect. Not coincidentally, Hollywood Rip Ride Rockit averaged a 32-minute wait, two minutes more.
Universal Studios Florida – Everything Else

Photo: Universal Orlando
Among the park’s biggies, the thrill rides were flat, but the children’s attractions soared in popularity.
Did that trend continue with the rest of the park? Here are the other Universal Studios Florida wait times:
- TRANSFORMERS: The Ride 3D – 37 minutes, up 7
- Race Through New York Starring Jimmy Fallon – 34 minutes, up 12
- T. Adventure – 33 minutes, up 1
- Hogwarts Express – King’s Cross Station – 33 minutes, down 3
- The Simpsons Ride – 33 minutes, up 4
- Trolls Trollercoaster – 31 minutes, up 19
- MEN IN BLACK Alien Attack! – 24 minutes, up 1
- Fast & Furious – Supercharged – 21 minutes, up 4
- Kang & Kodos’ Twirl ‘n’ Hurl – 20 minutes, up 2
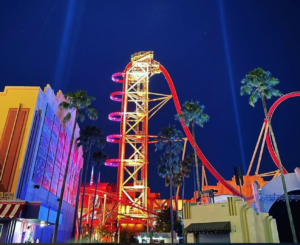
Photo:instagram/universalorlando
As a point of clarity, I listed the horrifically named Trollercoaster last month.
The attraction was performing previews at the time. So, only a smattering of park guests were experiencing the ride.
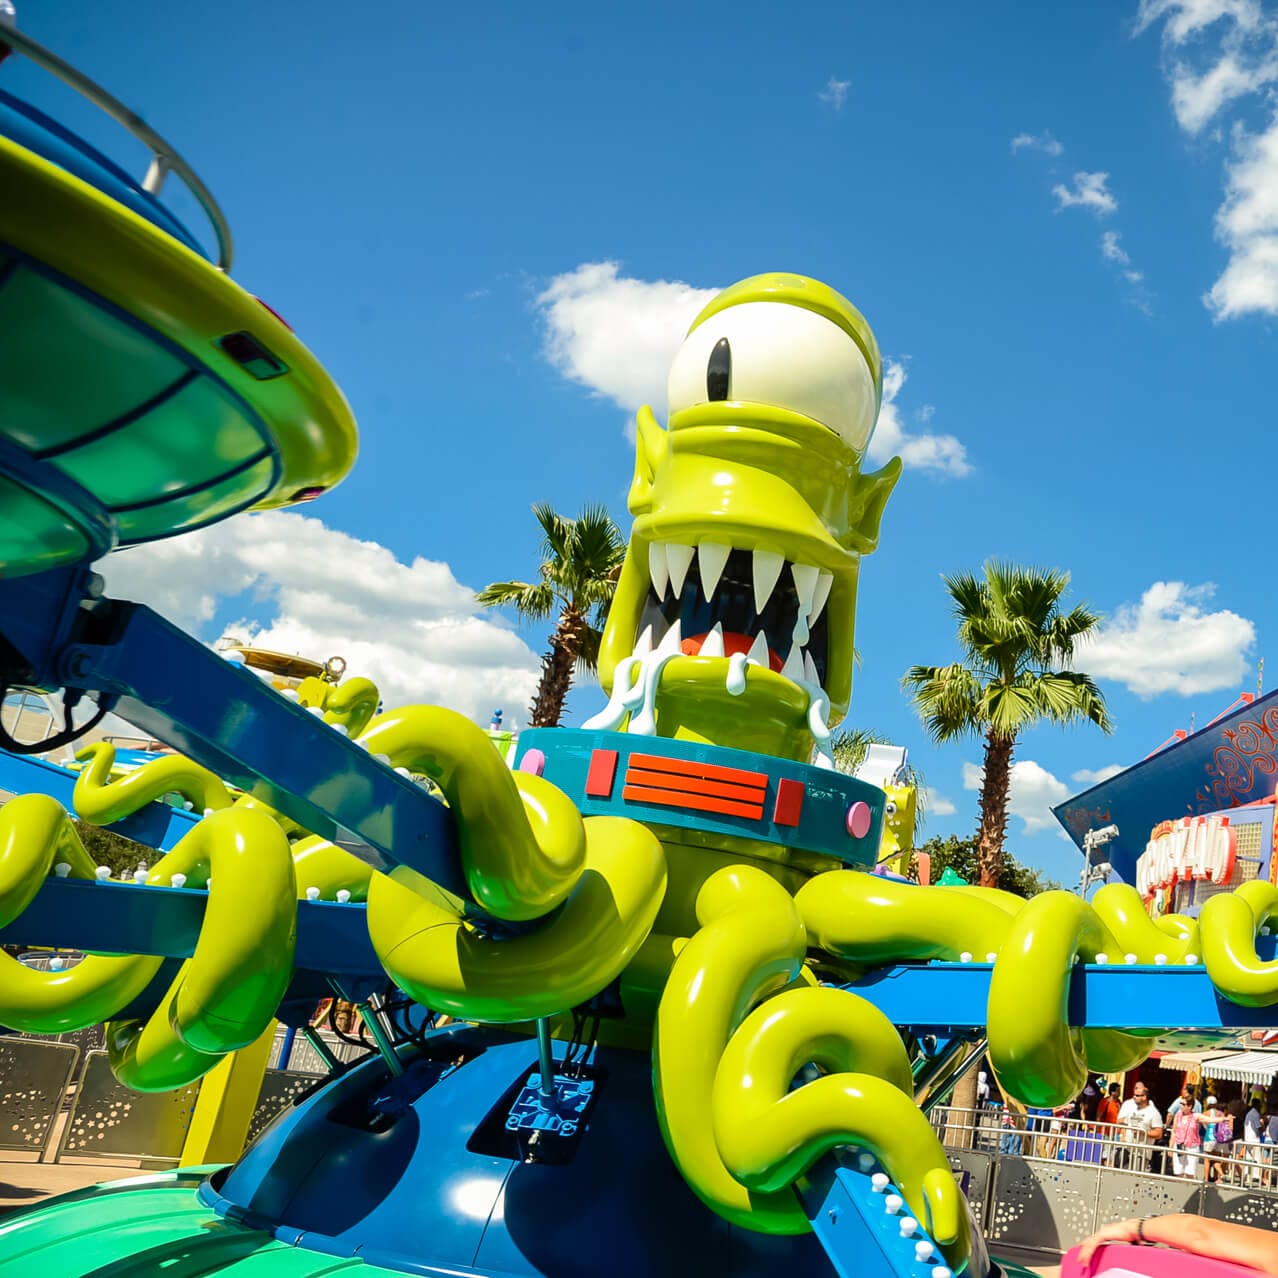
Photo: Universal
This latest number reflects its actual opening date of June 14th, which means this is still only a half-month of data.
As such, don’t read much into that number. We probably won’t know standard wait time behavior here until the fall.

Photo: USA Today
Overall, Universal Studios Florida attractions averaged a wait of 32 minutes, which is four minutes more than last time.
That’s a fairly typical May-to-June growth for theme parks. So, I’m not noticing much of an impact from DreamWorks Land yet.
Universal’s Islands of Adventure
Still, the crowds obviously increased at one park. Of course, that was the one offering limited-time summer fare.
Universal officials would be a bit freaked out if the wait times were still down after they put their thumb on the scale.
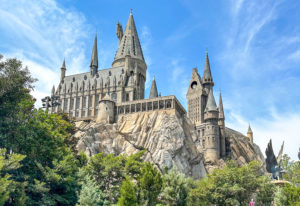
However, that’s still just one park. So, how were the crowds at Islands of Adventure?
Here are the park’s average wait times for the past month.
- Hagrid’s Magical Creatures Motorbike Adventure – 89 minutes, up 7
- Jurassic World VelociCoaster – 60 minutes, down 2
- Dudley Do-Right’s Ripsaw Falls – 56 minutes, up 6
- The Amazing Adventures of Spider-Man – 37 minutes, up 4
- Flight of the Hippogriff – 36 minutes, down 4
- The Incredible Hulk Coaster – 36 minutes, up 2
- Skull Island: Reign of Kong – 34 minutes, down 1
- Harry Potter and the Forbidden Journey – 30 minutes, up 2
- Jurassic Park River Adventure – 28 minutes, up 3
- Hogwarts Express – Hogsmeade Station – 27 minutes, up 1
- Popeye & Bluto’s Bilge-Rat Barges – 22 minutes, down 2
- The High in the Sky Seuss Trolley Train Ride! – 18 minutes, down 2
- One Fish, Two Fish, Red Fish, Blue Fish – 18 minutes, down 9
- Doctor Doom’s Fearfall – 16 minutes, down 2
- The Cat in the Hat – 12 minutes, no change
- Storm Force Accelatron – 9 minutes, no change
- Caro-Seuss-el – 8 minutes, no change
Final Thoughts
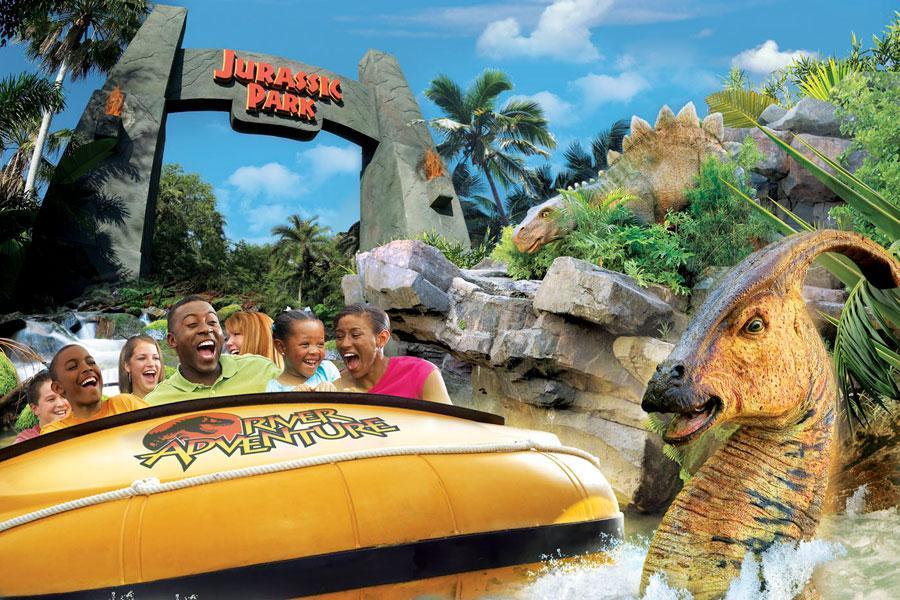
Photo: Universal Orlando
Overall, guests at the park waited for an average of 31 minutes per attraction, which is the same as in May.
So, Islands of Adventure didn’t get a bump from the limited-time engagements, and it’s also flat with the non-summer dates.
Photo:instagram/universalorlando
Based on what I’m seeing here, people do seem to be skipping the summer at Universal Studios in anticipation of next year.
Of course, the July data could change my mind. So, check back next month!

Thanks for visiting UniversalParksBlog.com! Want to go to Universal? For a FREE quote on your next Universal vacation, please fill out the form below and one of the agents from Let’s Adventure Travel will be in touch soon!
Feature Photo: IG/ @thejourneyduo

