Universal Studios Wait Times for November 2023
We’ve entered the saddest time of the year for Universal Studios fans.
With Halloween Horror Nights 2023 in the books, we’ll spend the next ten months anxiously anticipating its return.
Photo: NBC via Getty Images
As you know, all of us crowd the parks during Halloween season to celebrate the brilliant Houses and Scare Zones.
What did that do to the wait times for the month? Well, the answer may surprise you.
Here are the average wait times for November 2023.
Universal Studios Florida – The Big Five
As a reminder, while we call this the November update due to the timing, the wait times cover the previous month.
So, we’re taking a hard look at how Halloween impacts the parks.
While your instinct is to expect mobs, let’s remember that it’s technically the offseason.

Jungle of Doom
Theme parks were historically dead zones (no pun intended) during the fall.
The passion people have for Halloween Horror Nights (HHN) counterbalances the slow season, at least somewhat.
Our debate lies in which factor proves to be the determining one. And the answer has gone both ways over the past few years.
For 2023, we can finally answer the question without any lingering impact of the pandemic, though.
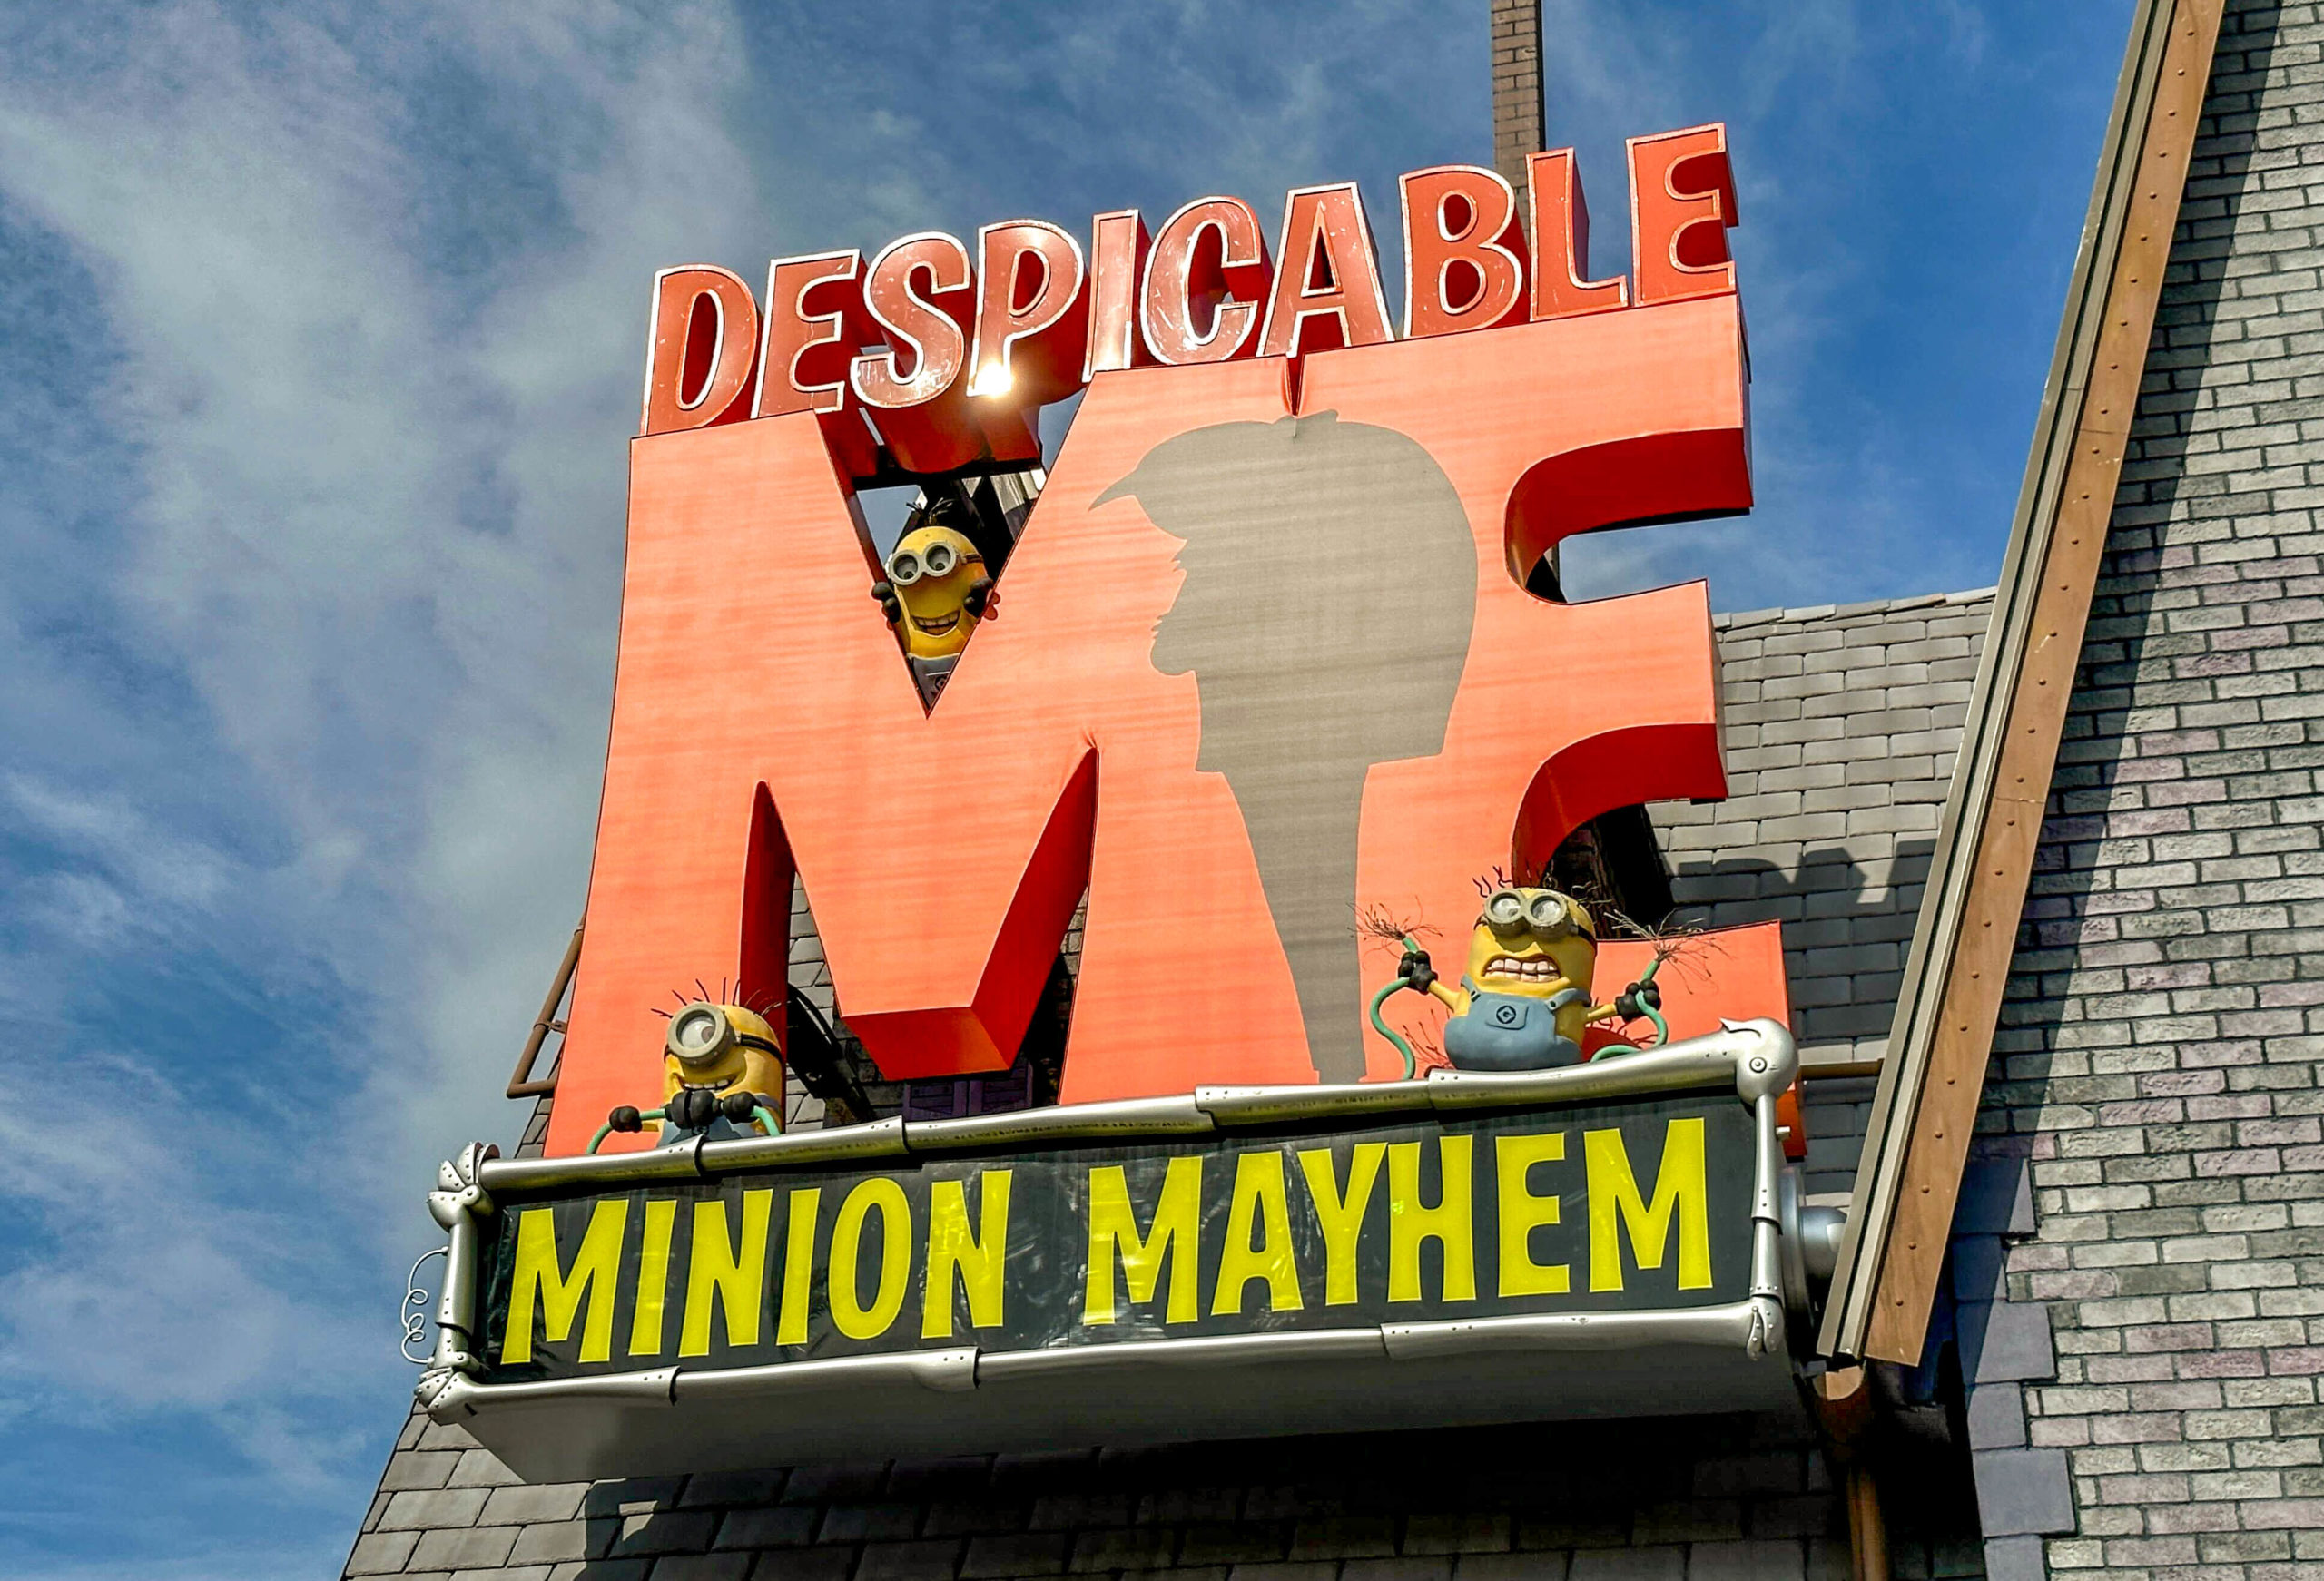
Even then, we’ve still got a new factor, though. The arrival of Minion Land has renewed interest in Universal Studios Florida.
Specifically, the two attractions here definitely claim larger crowds than the previous area had in 2021 and 2022.
For the past month, Despicable Me: Minion Mayhem averaged a wait of 43 minutes.
That’s 11 minutes more than last month. It’s not a new phenomenon, though. During the same timeframe last year, the wait was 45 minutes.
Universal’s latest ride, Illumination’s Villain-Con Minion Blast averaged a wait of 38 minutes, which is six minutes longer than last time.
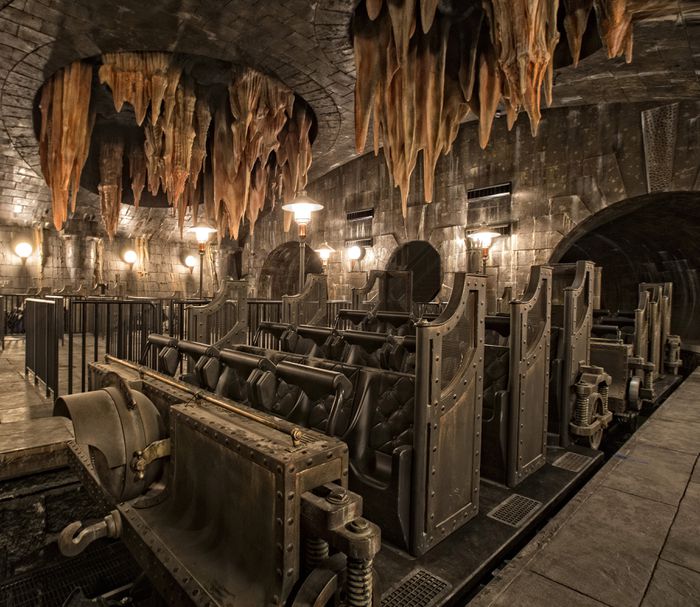
Photo: Universal
Among the other members of the Big Five, Harry Potter and the Escape from Gringotts averaged a 61-minute wait, which is 17 minutes more than last time.
Similarly, Hollywood Rip Ride Rockit averaged a wait of 47 minutes, which is up 18 minutes.
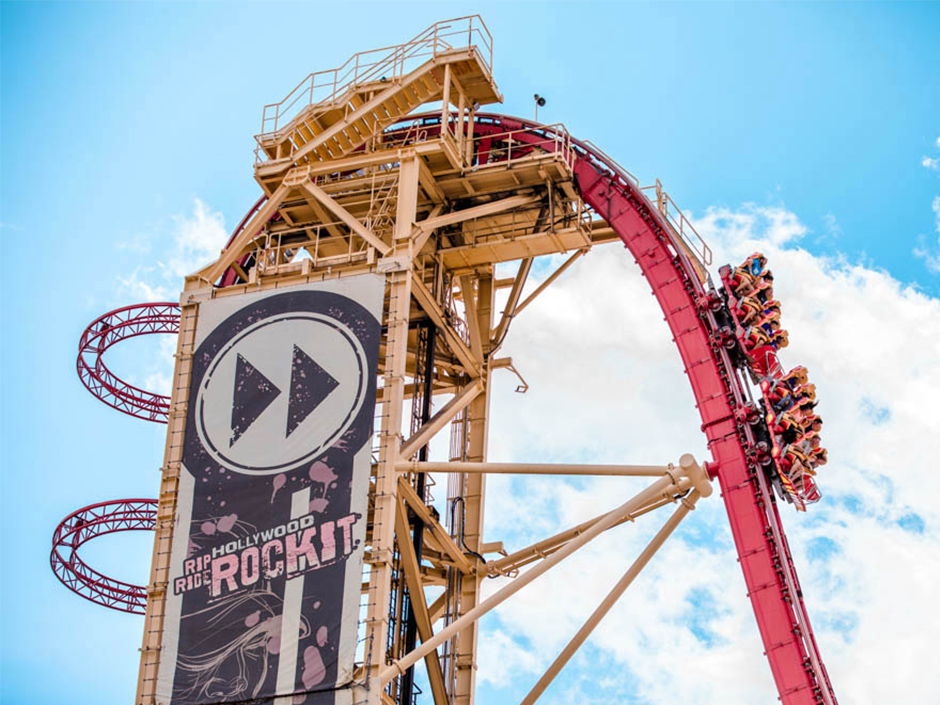
Image Credit: Universal
Finally, Revenge of the Mummy required an average wait of 46 minutes, which is 12 minutes more than last time.
So, you can already tell that the park was MUCH more crowded than during September.
Universal Studios Florida – Everything Else
Did this trend hold for the other attractions? Let’s check.
Here are the other average wait times at Universal Studios Florida:
- Hogwarts Express: King’s Cross Station – 49 minutes, up 10
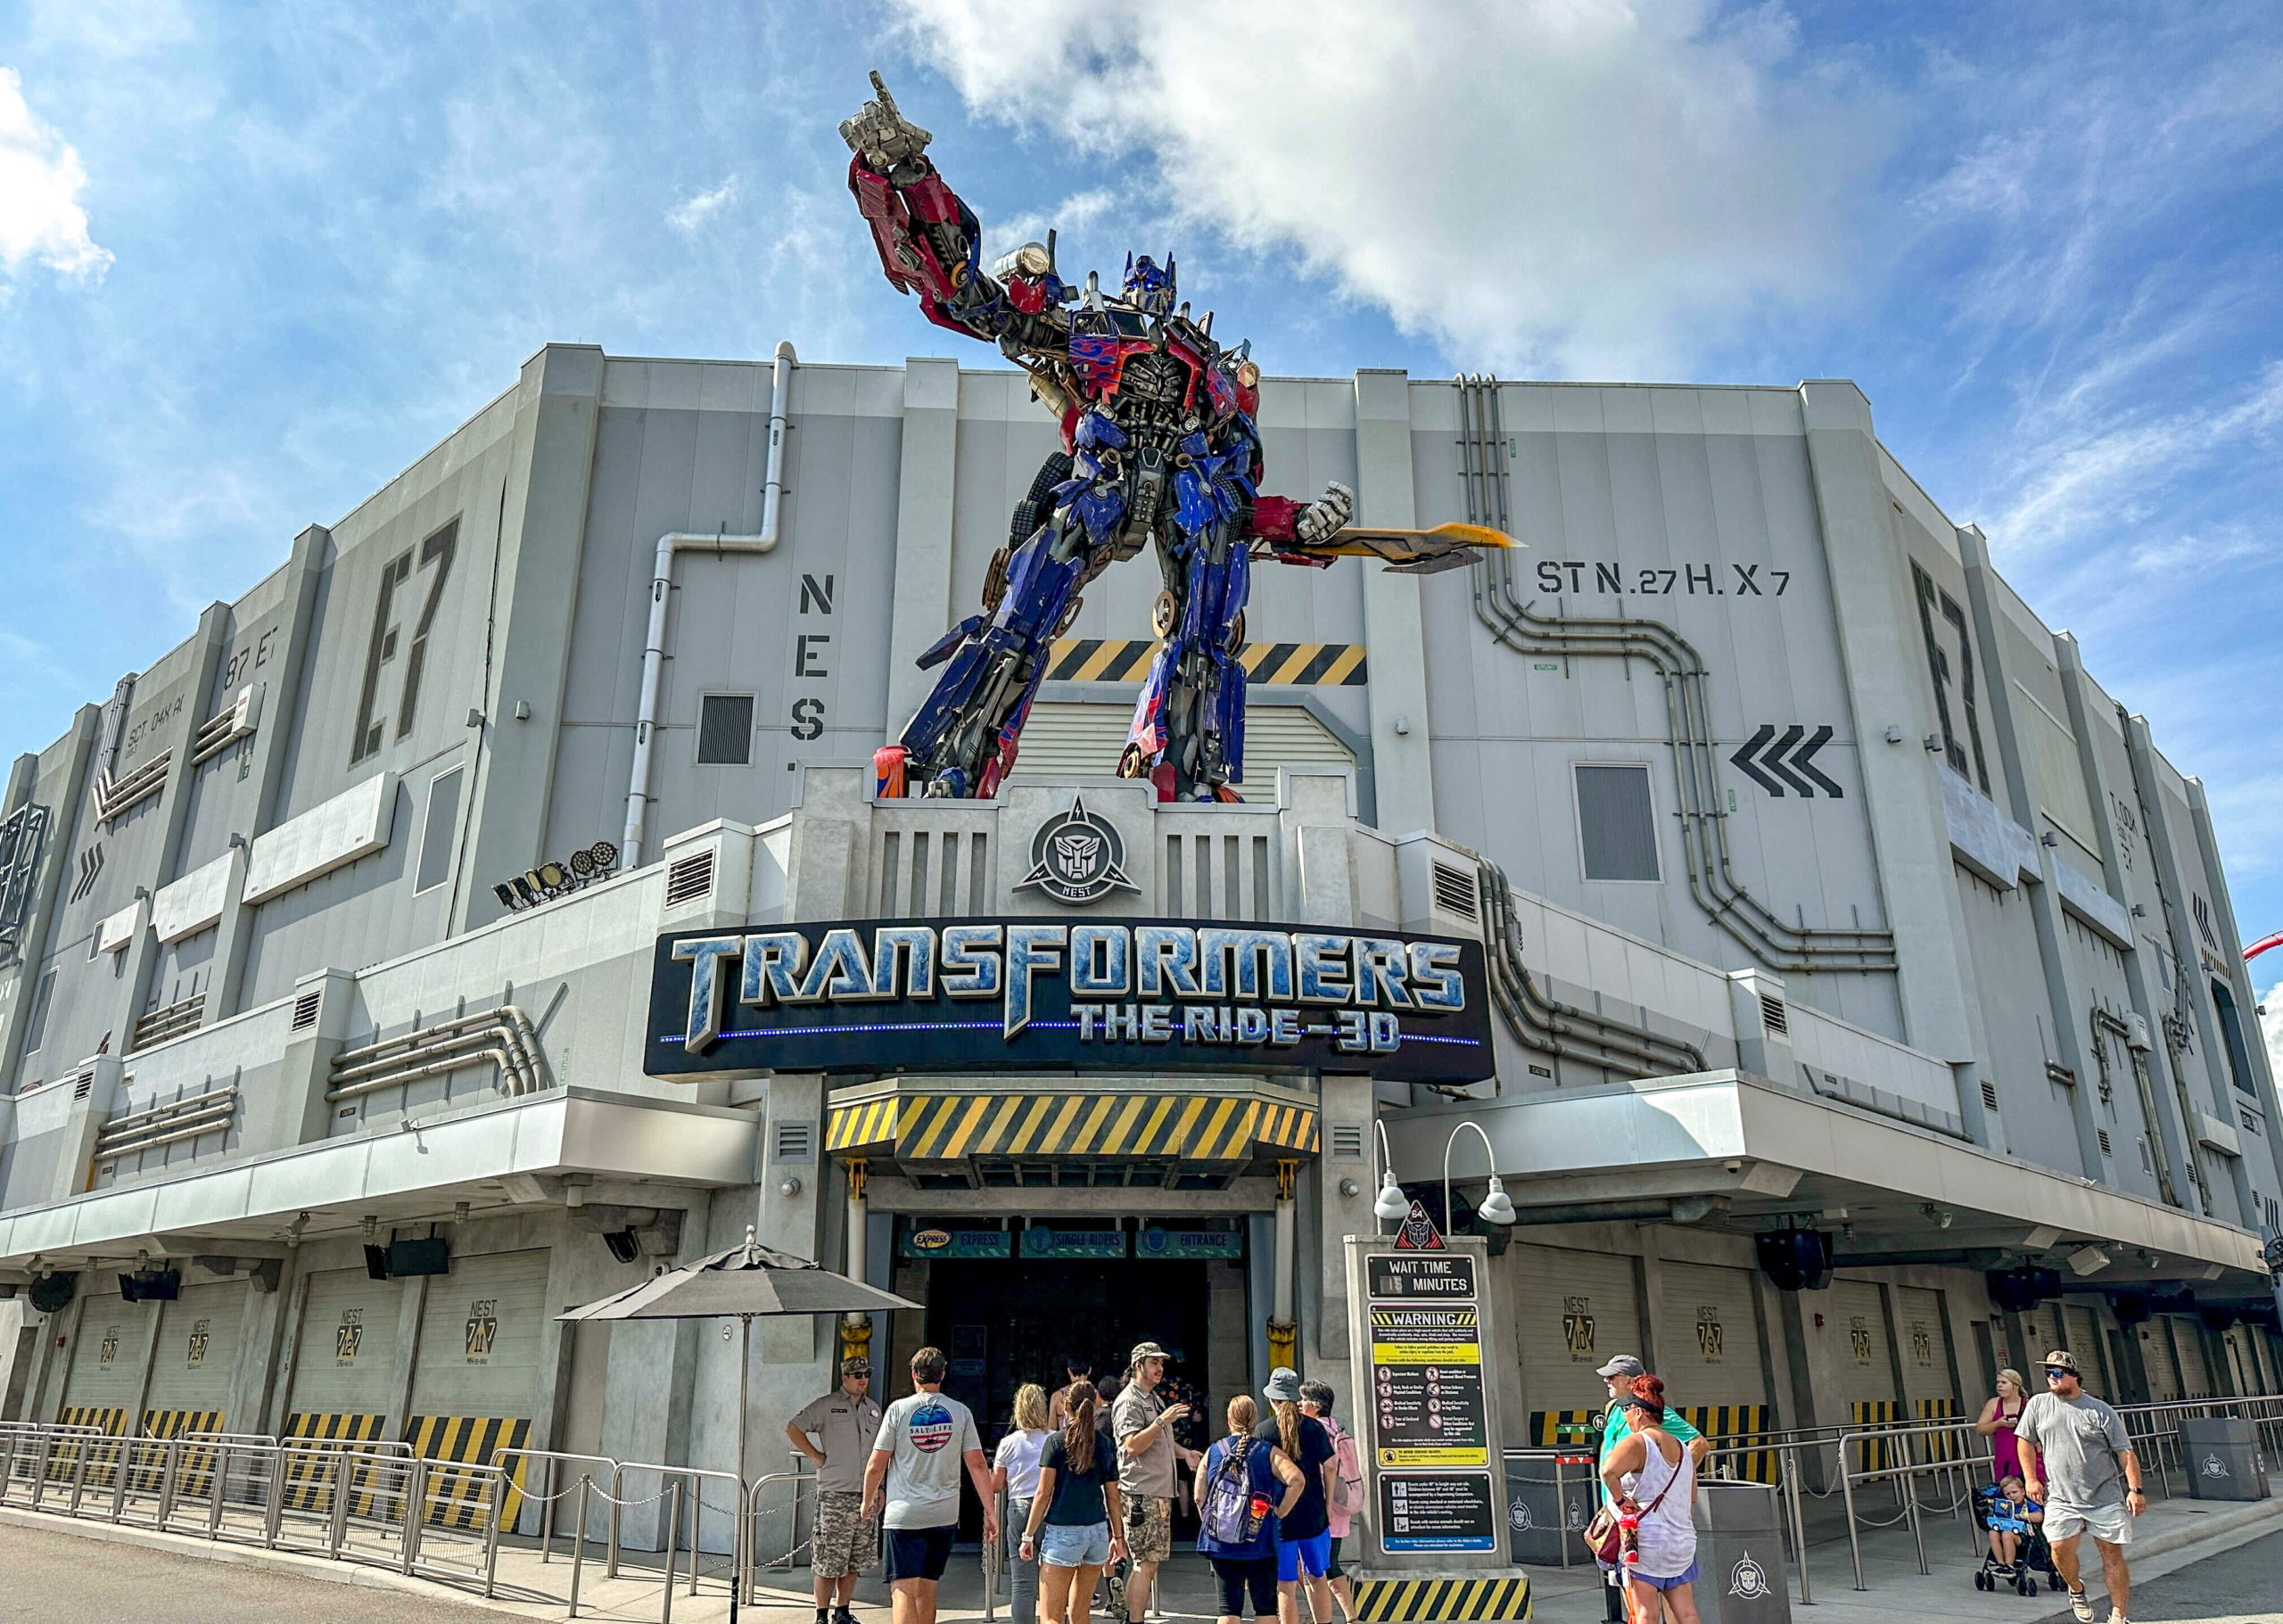
- Transformers: The Ride – 3D – 39 minutes, up 6
- E. T. Adventure Ride – 34 minutes, up 7
- The Simpsons Ride – 30 minutes, up 5
- Race Through New York Starring Jimmy Fallon – 29 minutes, up 5
- Fast & Furious – Supercharged – 28 minutes, up 5
- MEN IN BLACK Alien Attack – 25 minutes, up 5
- Kang & Kodos’ Twirl ‘n’ Hurl – 23 minutes, up 8
Overall, guests at Universal Studios Florida stood in line for an average of 37 minutes, which is eight minutes more than last time.
Notably, that is 12 (!!!) minutes more than we tracked last year. We can safely say that this year’s HHN has been a massive success.
Universal’s Islands of Adventure
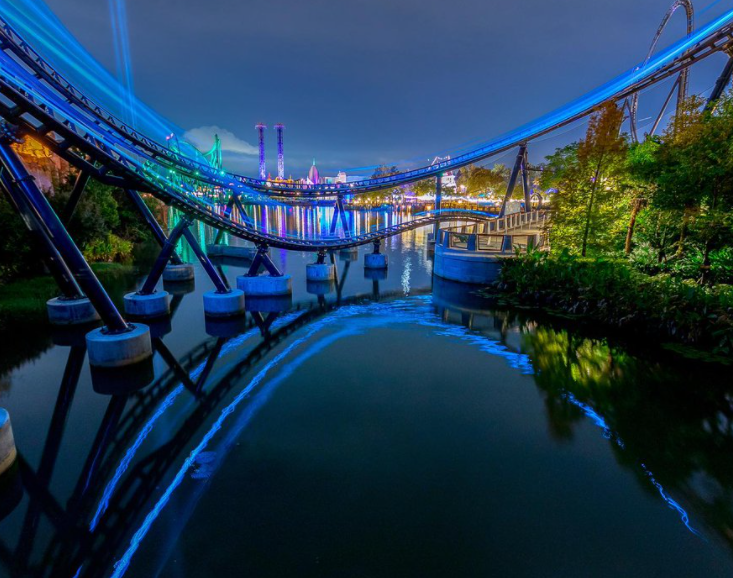
Photo: IG/ @thejourneyduo
Here are the wait times for Islands of Adventure during October:
- Hagrid’s Magical Creatures Motorbike Adventure – 93 minutes, up 14
- Jurassic World VelociCoaster – 79 minutes, up 28
- Skull Island: Reign of Kong – 40 minutes, up 12
- Flight of the Hippogriff – 39 minutes, up 16
- Pteranodon Flyers – 38 minutes, up 9
- The Incredible Hulk Coaster – 36 minutes, up 10
- Harry Potter and the Forbidden Journey – 33 minutes, up 5
- The High in the Sky Seuss Trolley Train Ride! – 31 minutes, up 10
- The Amazing Adventures of Spider-Man – 30 minutes, up 7
- Jurassic Park River Adventure Ride – 27 minutes, up 3
- Hogwarts Express: Hogsmeade Station – 23 minutes, up 4
- Dudley Do-Right’s Ripsaw Falls – 18 minutes, down 23
- Doctor Doom’s Fearfall – 15 minutes, up 2
- Popeye & Bluto Bilge-Rat Barges – 15 minutes, down 1
- One Fish, Two Fish, Red Fish, Blue Fish – 13 minutes, up 3
- The Cat in the Ride – 12 minutes, up 1
- Storm Force Accelatron – 9 minutes, up 1
- Caro-Seuss-el – 8 minutes, no change
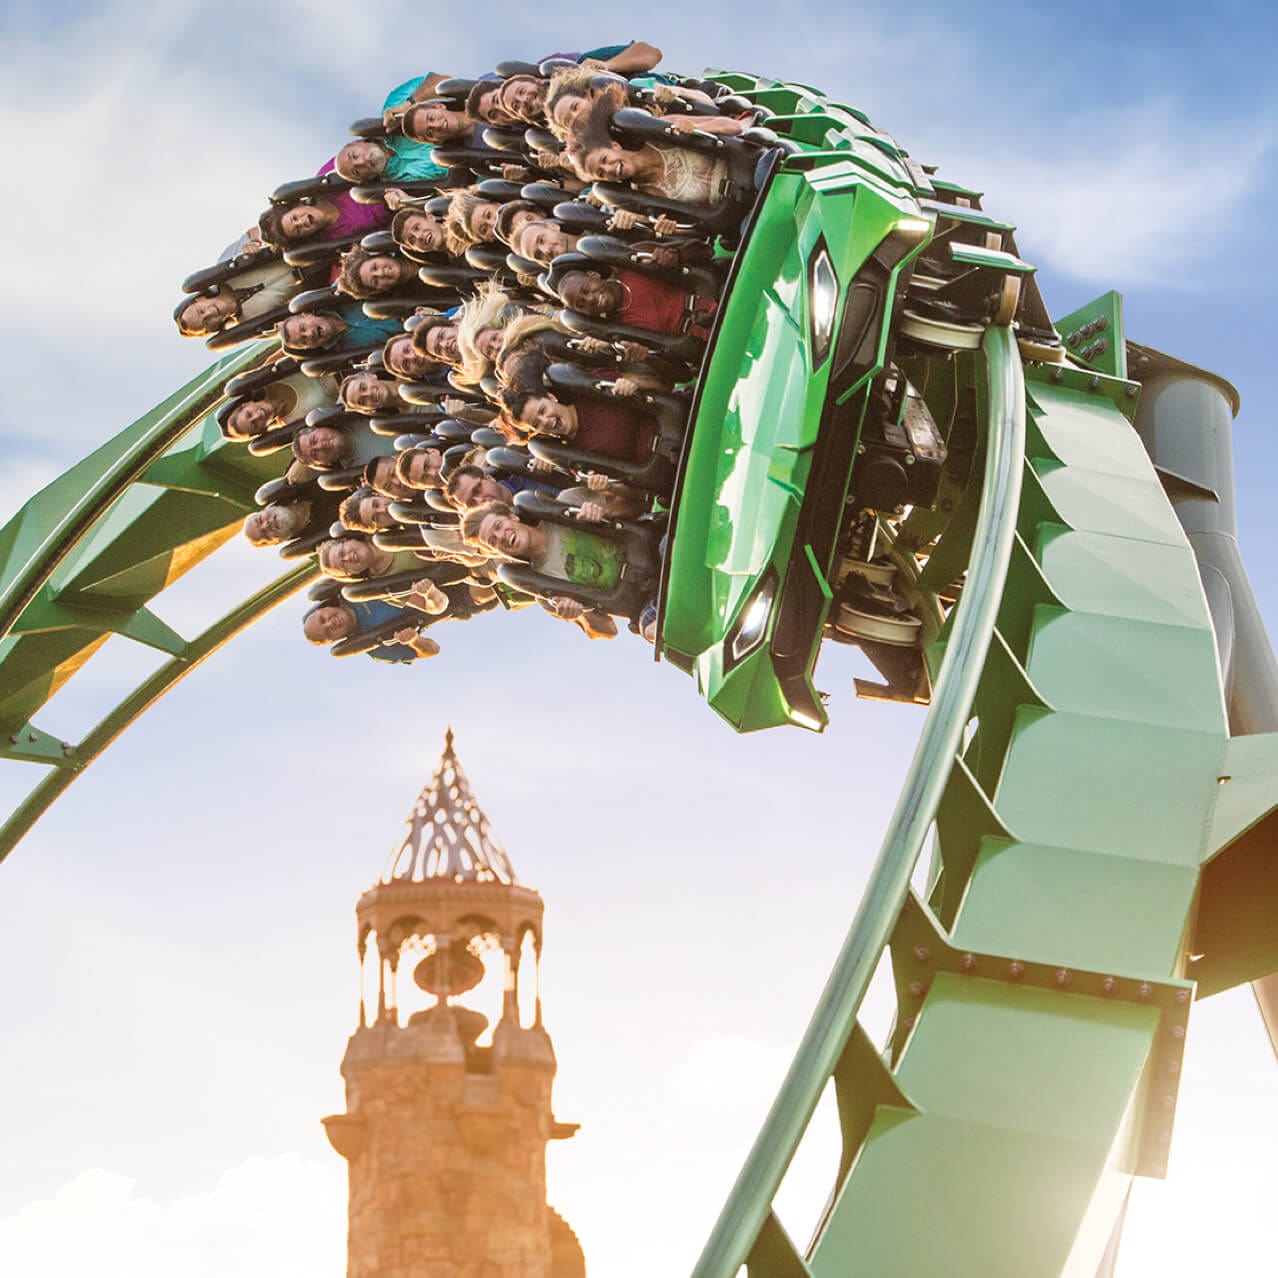
Photo: Universal
Overall, guests at Islands of Adventure stood in line for an average of 32 minutes, which is seven minutes more than the previous month.
That number also reflects growth of roughly 16 percent year-over-year.
So, yes, Universal Orlando Resort’s theme parks were much more crowded during HHN 2023.

Thanks for visiting UniversalParksBlog.com! Want to go to Universal? For a FREE quote on your next Universal vacation, please fill out the form below and one of the agents from Let’s Adventure Travel will be in touch soon!
Main image: Universal Studios

