How Were Epic Universe’s August Crowds?

Something unexpected happened at Universal Epic Universe this summer.
The park experienced a surprising attendance slowdown during the summer.

EPIC
To some extent, we should have expected a drop as the park entered year two.
The surprise stemmed from the degree of the decline this summer.

Today Show
Comcast, the corporate owner of Universal Studios, said as much.
Executives blamed several outside factors for the park’s slide.
Attractions Magazine
Critics have alluded to other issues, including the Stardust Racers tragedy.
We may never know who’s right or wrong about this one.

Universal
All we can say for sure is that Epic’s June and July crowds weren’t up to snuff.
So, how were the August crowds at Epic Universe?
Attractions magazine
Spoilers: The park’s not abandoned or anything, but it should be doing better.
The Wait Times at Berk
Universal
When I say something like that, I should back it up with specifics.
So, let’s start with the data and then work our way backward with the analysis.
Attractins Magazine
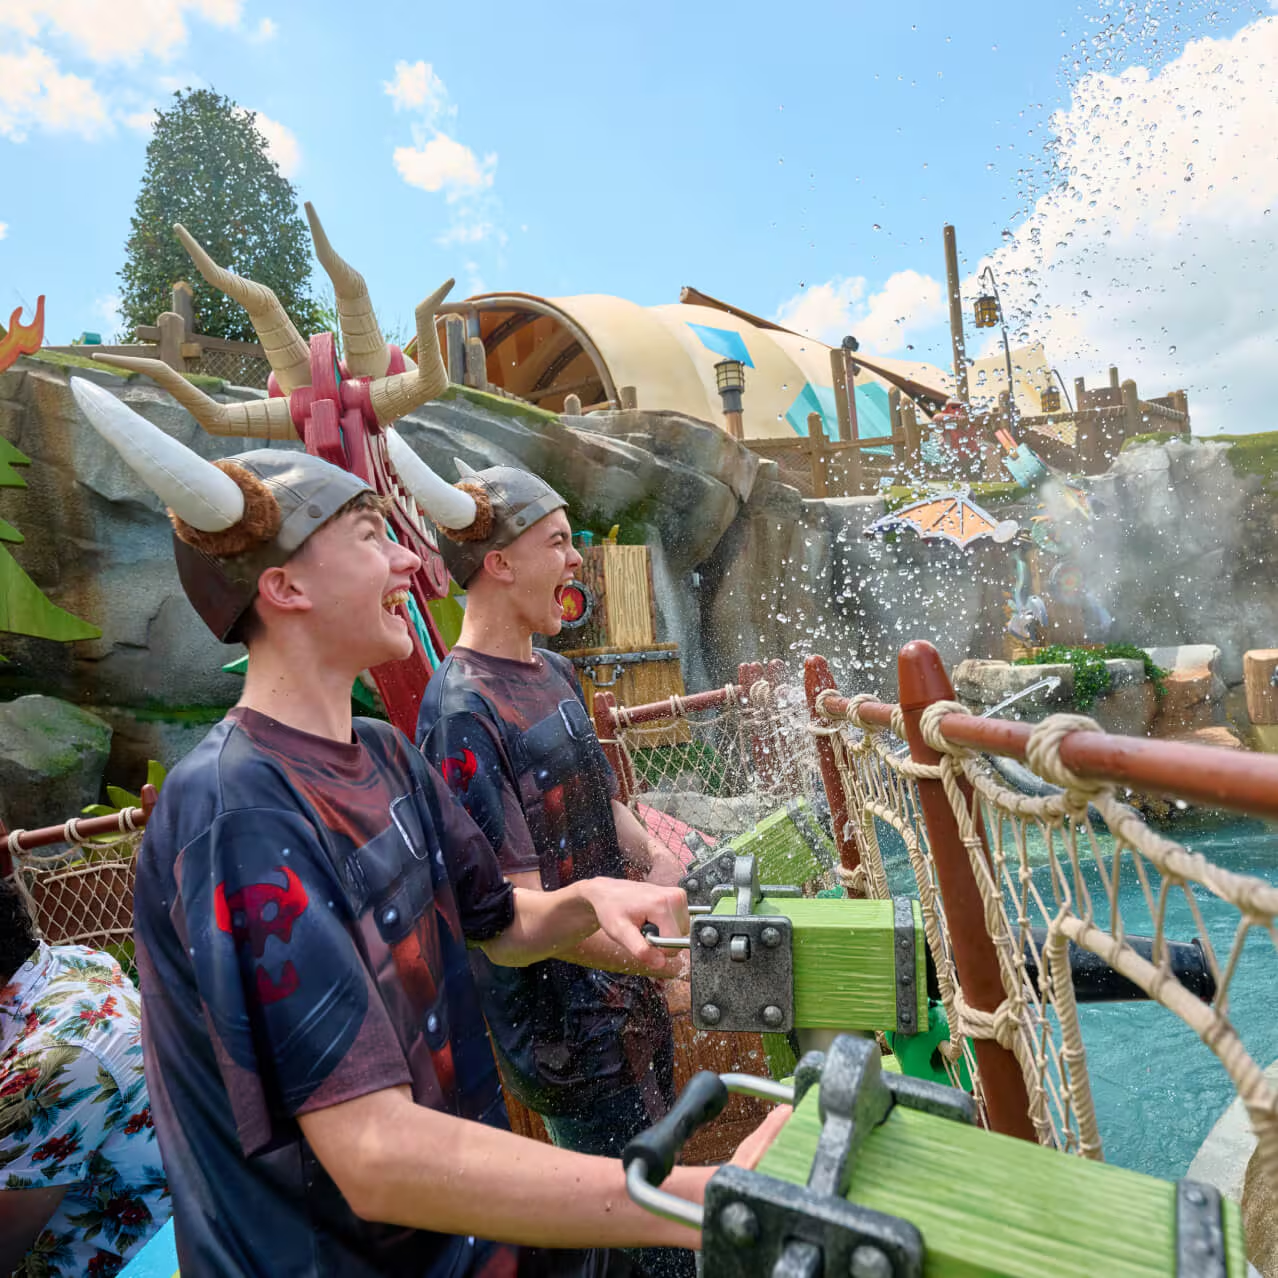
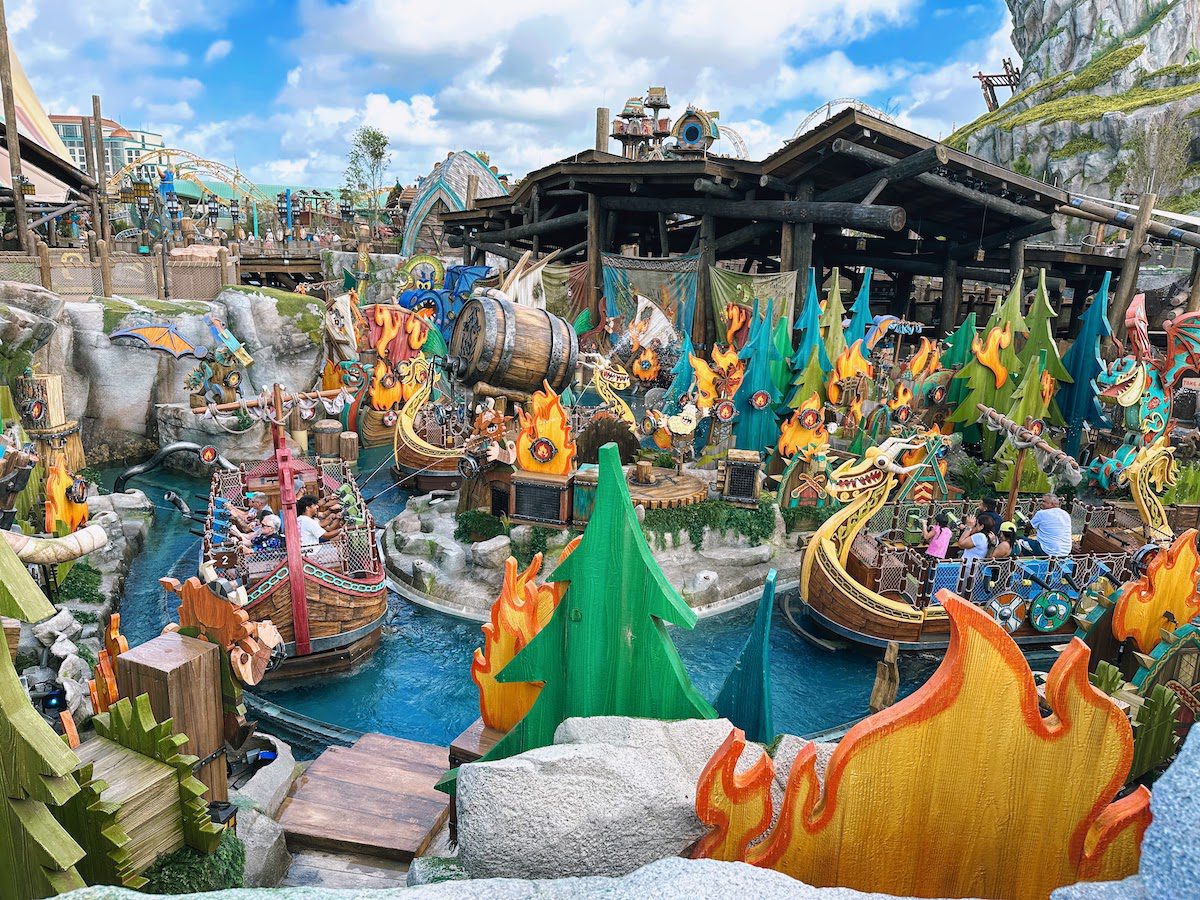
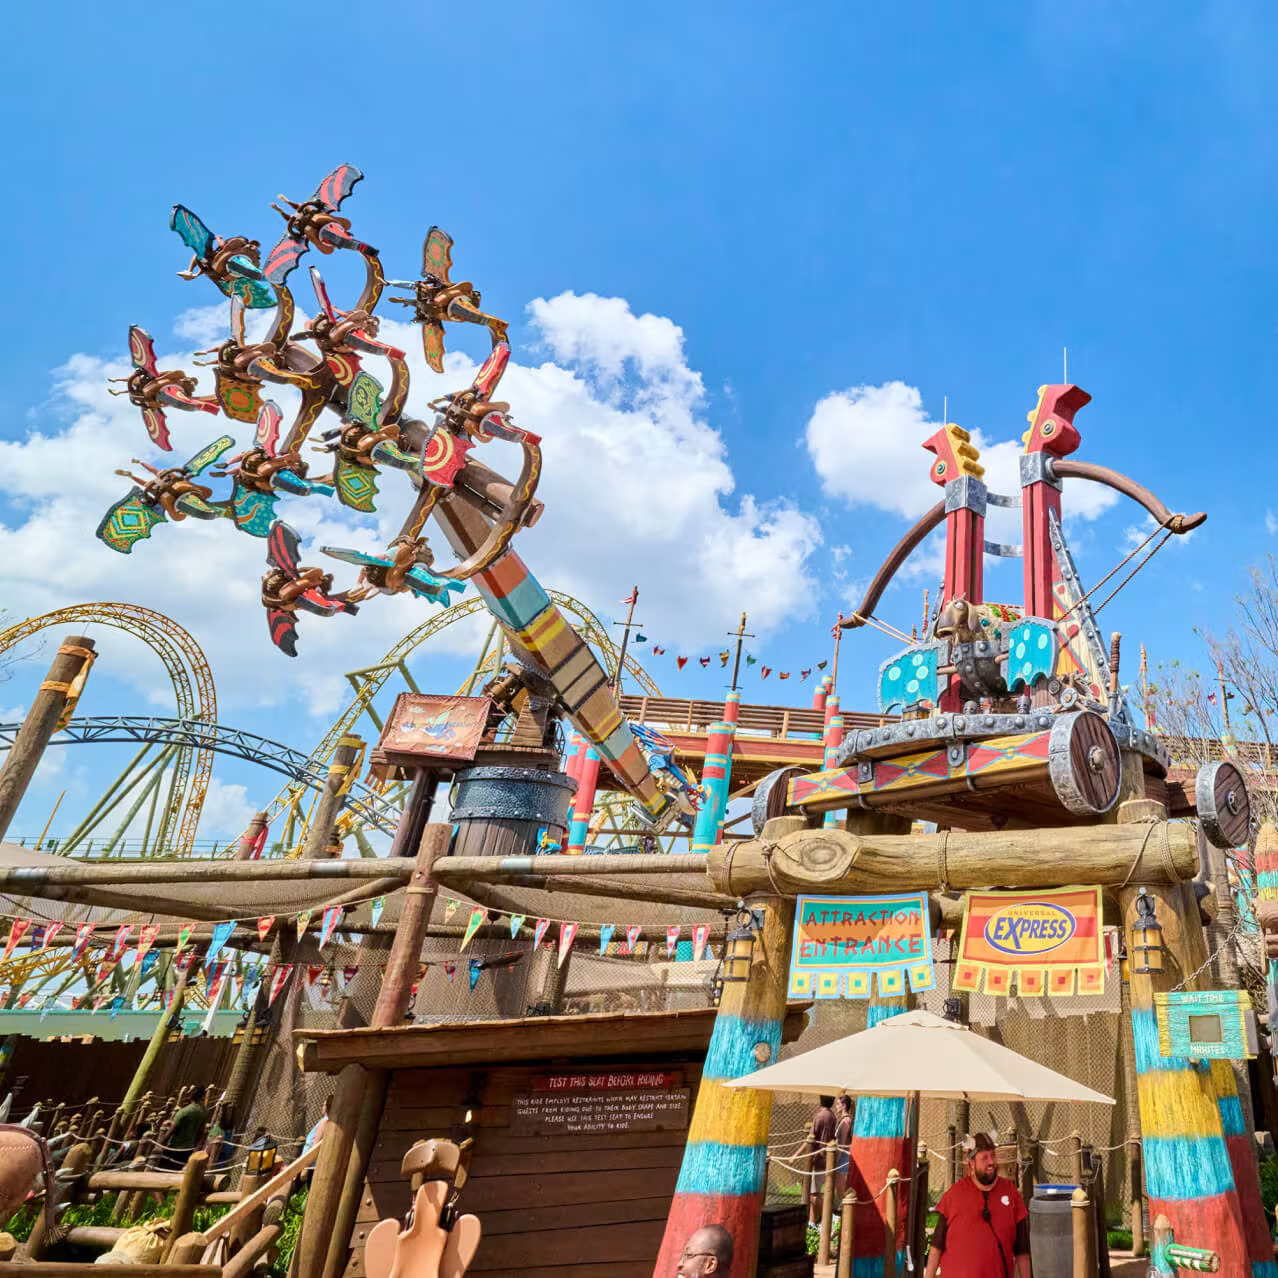
Here are the average wait times at Berk last month:
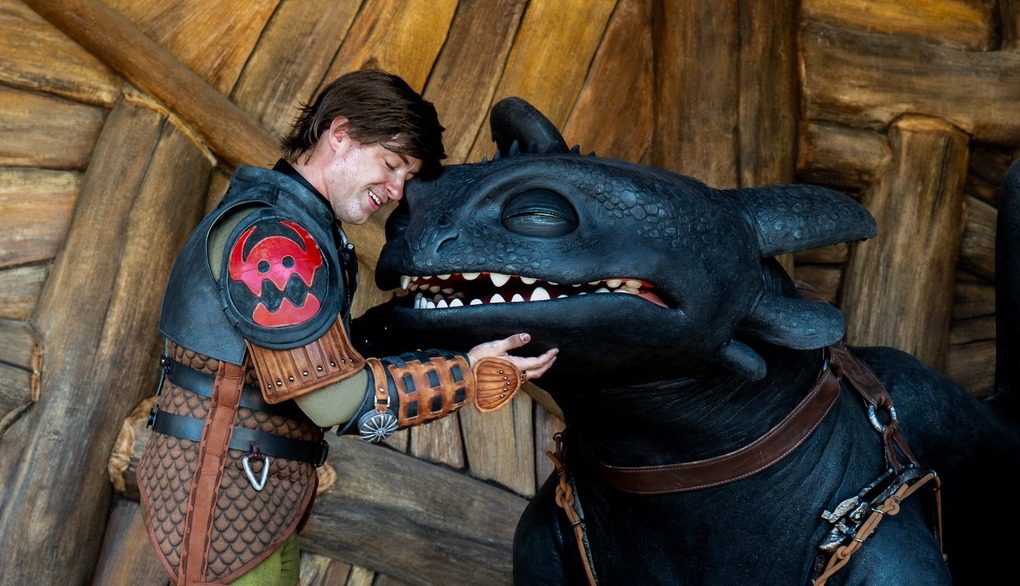
- Meet Toothless and Friends – 57 minutes, down 2
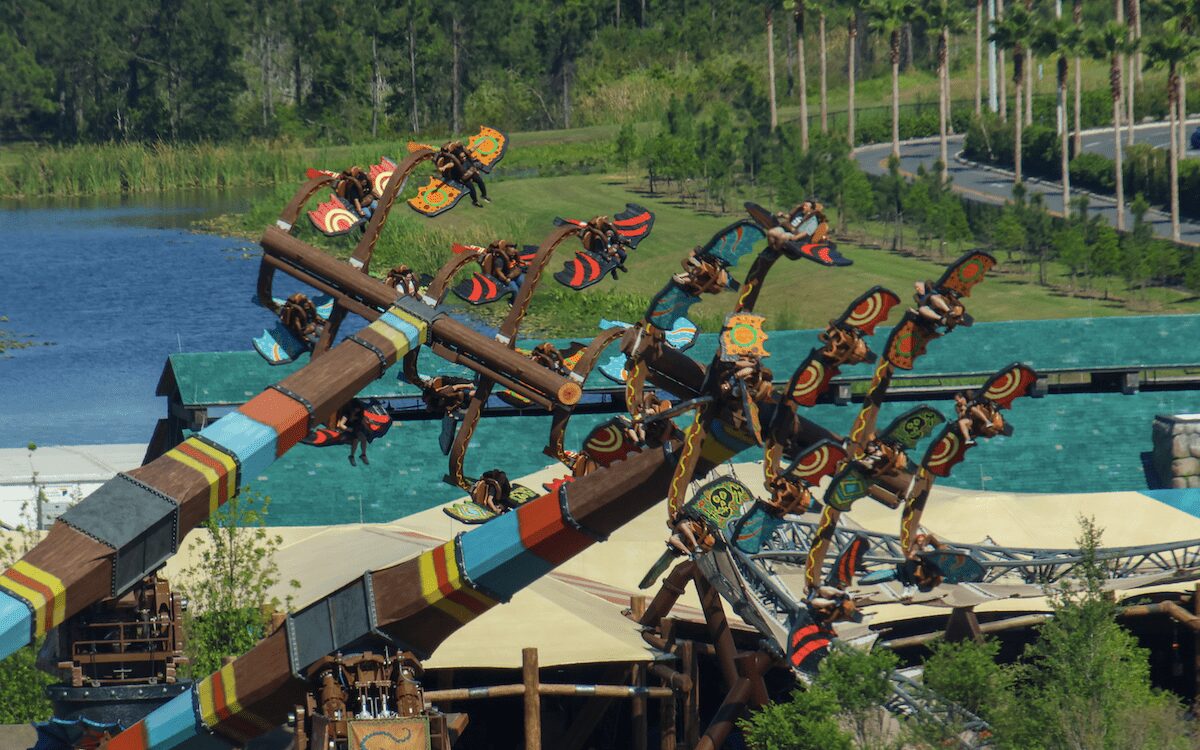
- Hiccup’s Wing Gliders – 35 minutes, down 5
- Dragon Racer’s Rally – 30 minutes, no change
- Fyre Drill – 28 minutes, down 7
Attractins Magazine
When you see those numbers, they sound quite reasonable, all things considered.
After all, school returned to session in most parts of North America.
Attractins magazine
While the dates vary by school system, this change always has an impact.
As a rule, Universal Studios faces less of an impact since it targets more adults.

Even so, we should always expect August to drop from July.
Here’s the problem. These are the average wait times from August 2025:
- Meet Toothless and Friends – 88 minutes
- Hiccup’s Wing Gliders – 64 minutes
- Fyre Drill – 53 minutes
- Dragon Racers’ Rally – 48 minutes
Attractions magazine
Obviously, second-year demand was never going to match that first magical summer.
Still, Berk’s wait times fell roughly 26 minutes per attraction. It’s an alarming stat.
The Wait Times at Dark Universe
Universal
You’re probably thinking to yourself, “Yeah, but that’s just Berk.”
So, here are the wait times at my favorite themed land here:
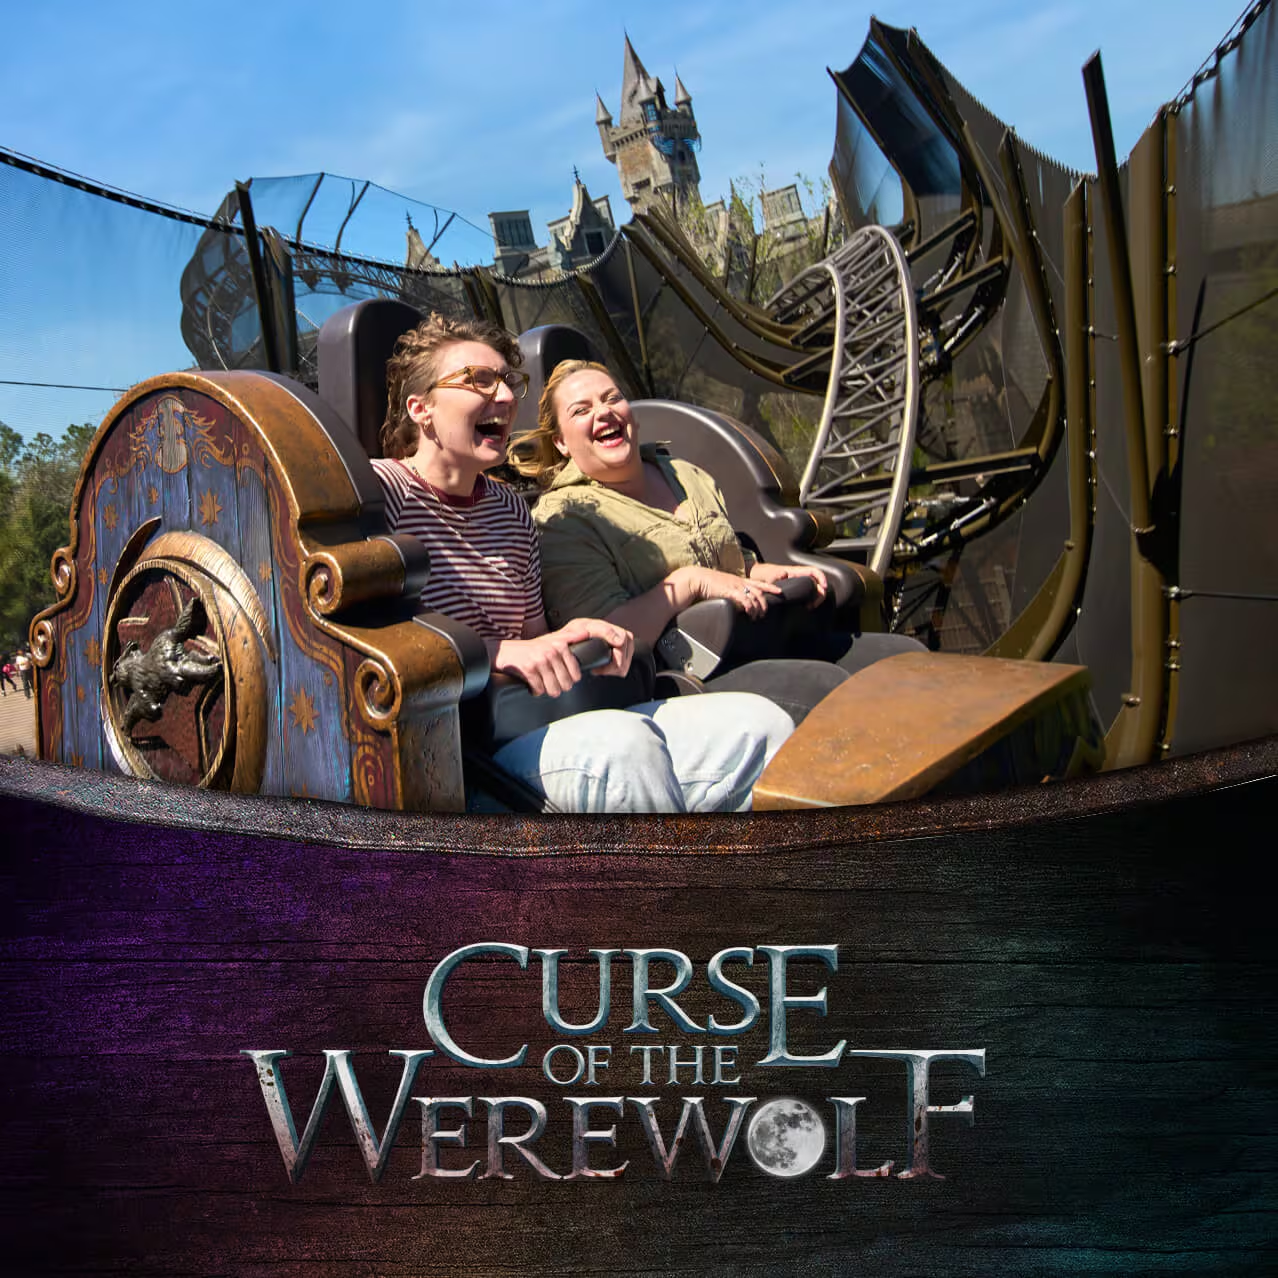
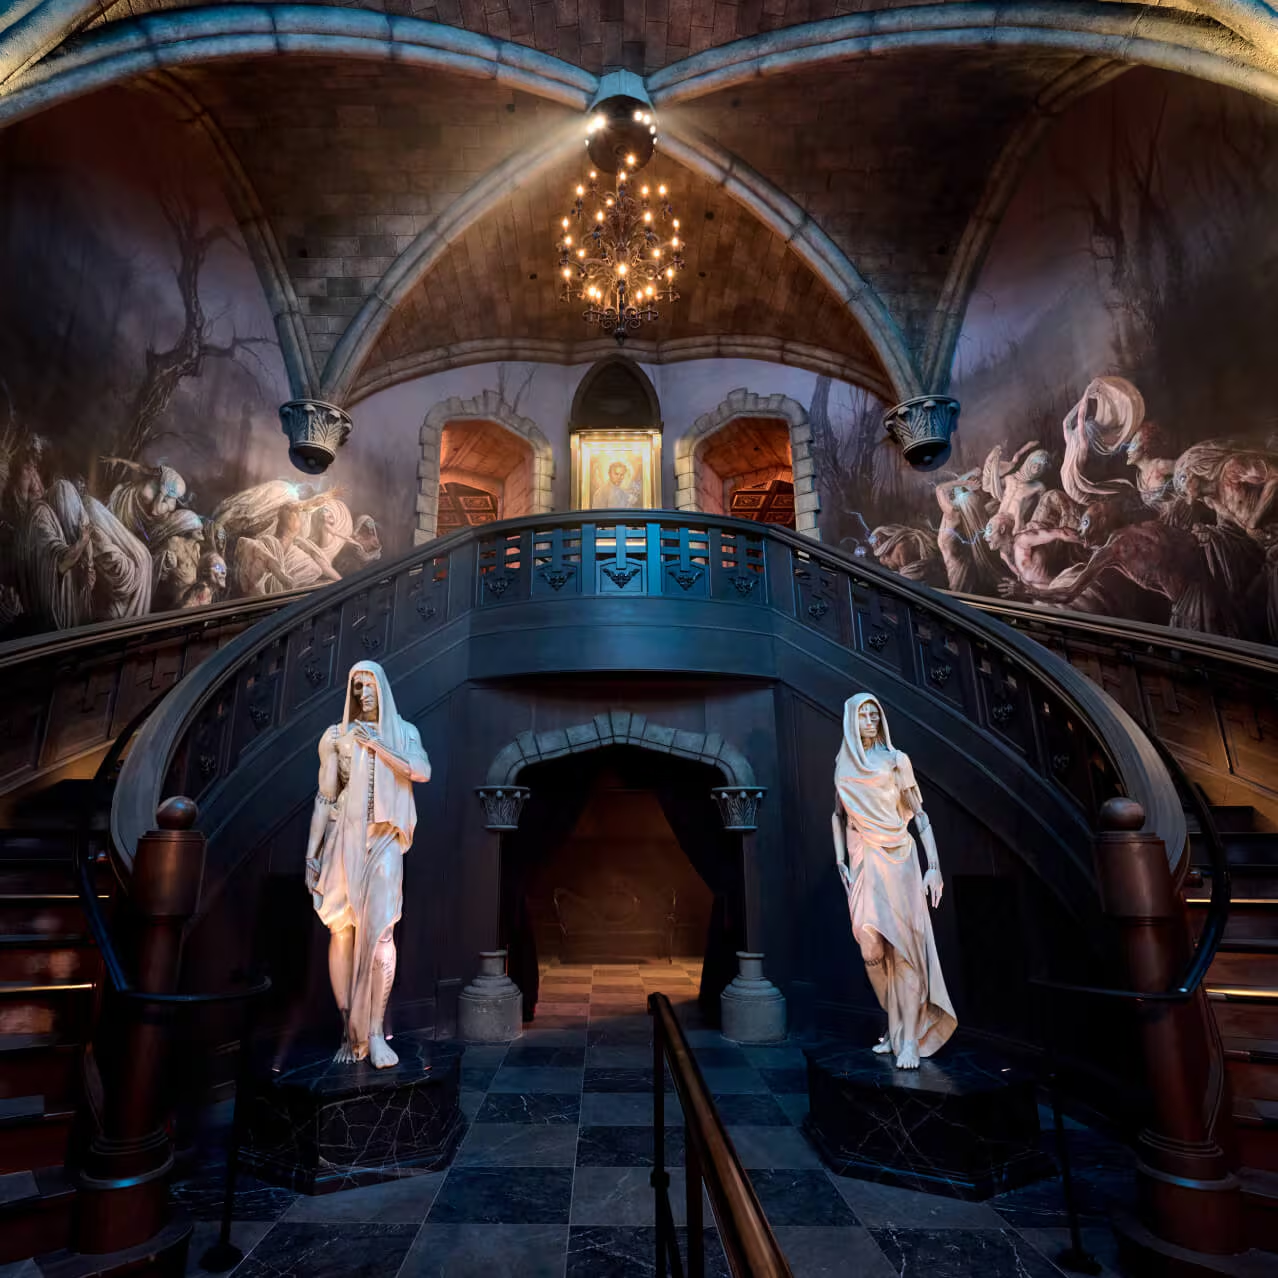
- Curse of the Werewolf – 41 minutes, down 2
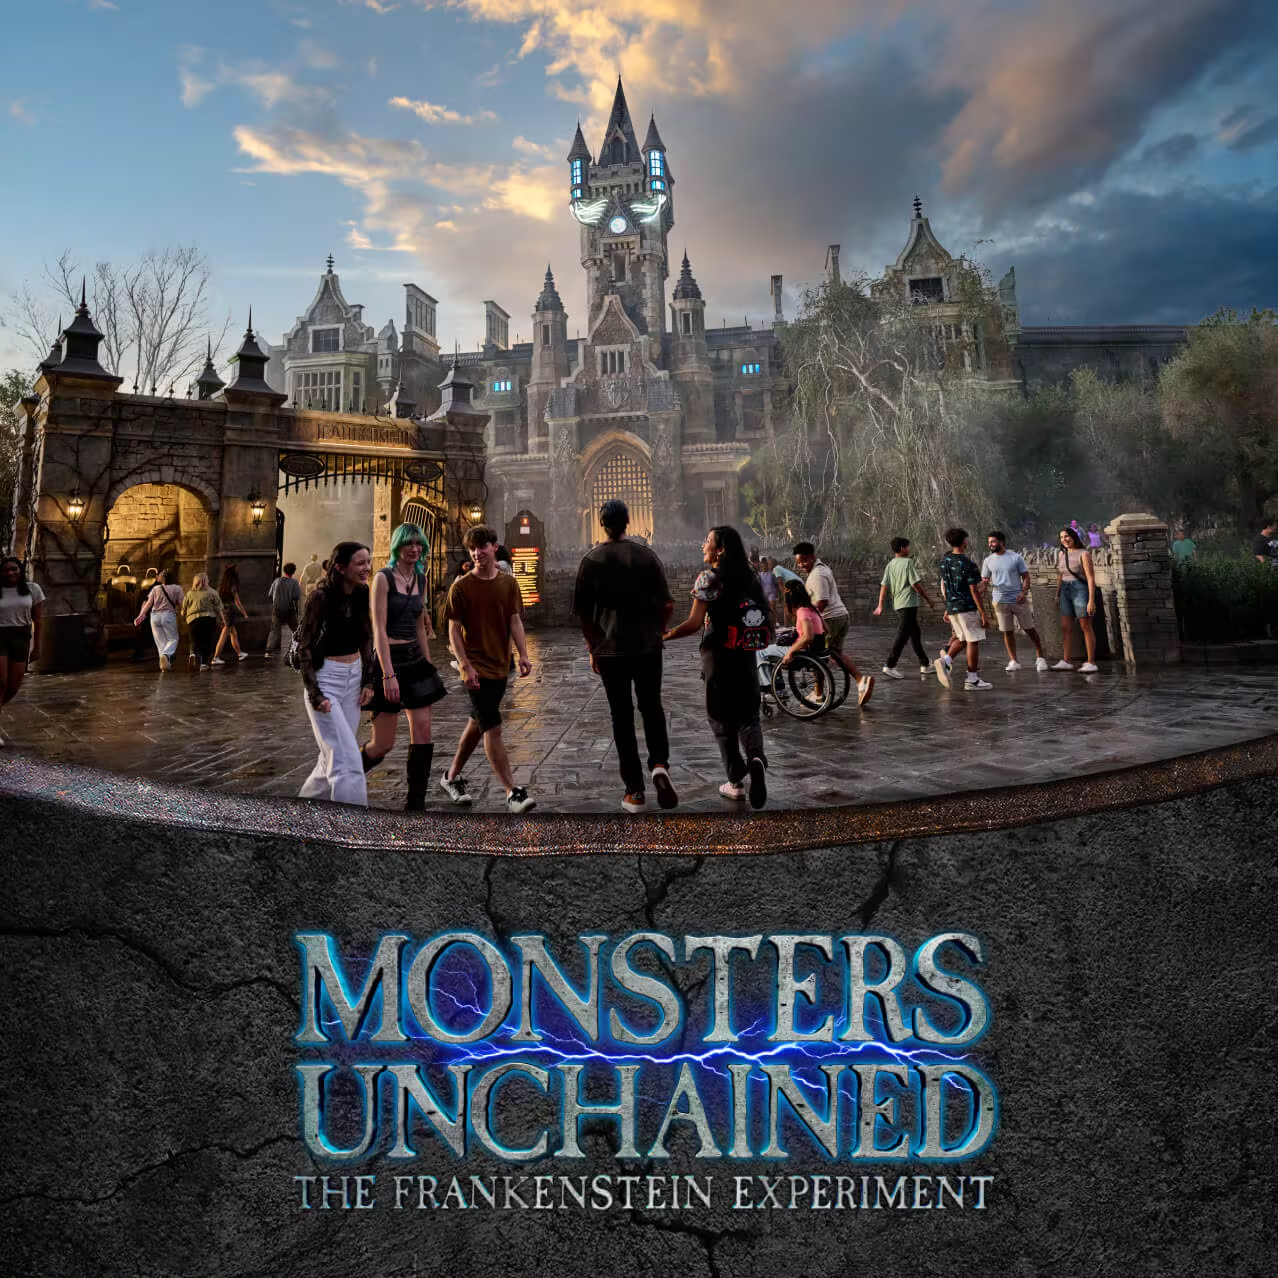
- Monsters Unchained: The Frankenstein Experiment – 17 minutes, down 2
Universal
Now, let’s contrast them to August 2025:
- Curse of the Werewolf – 55 minutes
- Monsters Unchained: The Frankenstein Experiment – 22 minutes
You’re starting to notice the problem, aren’t you? Well, it gets worse.
The Wait Times at the Wizarding World of Harry Potter

Photo: Universal
Now, the conversation takes a turn for the gruesome if you own Comcast stock.
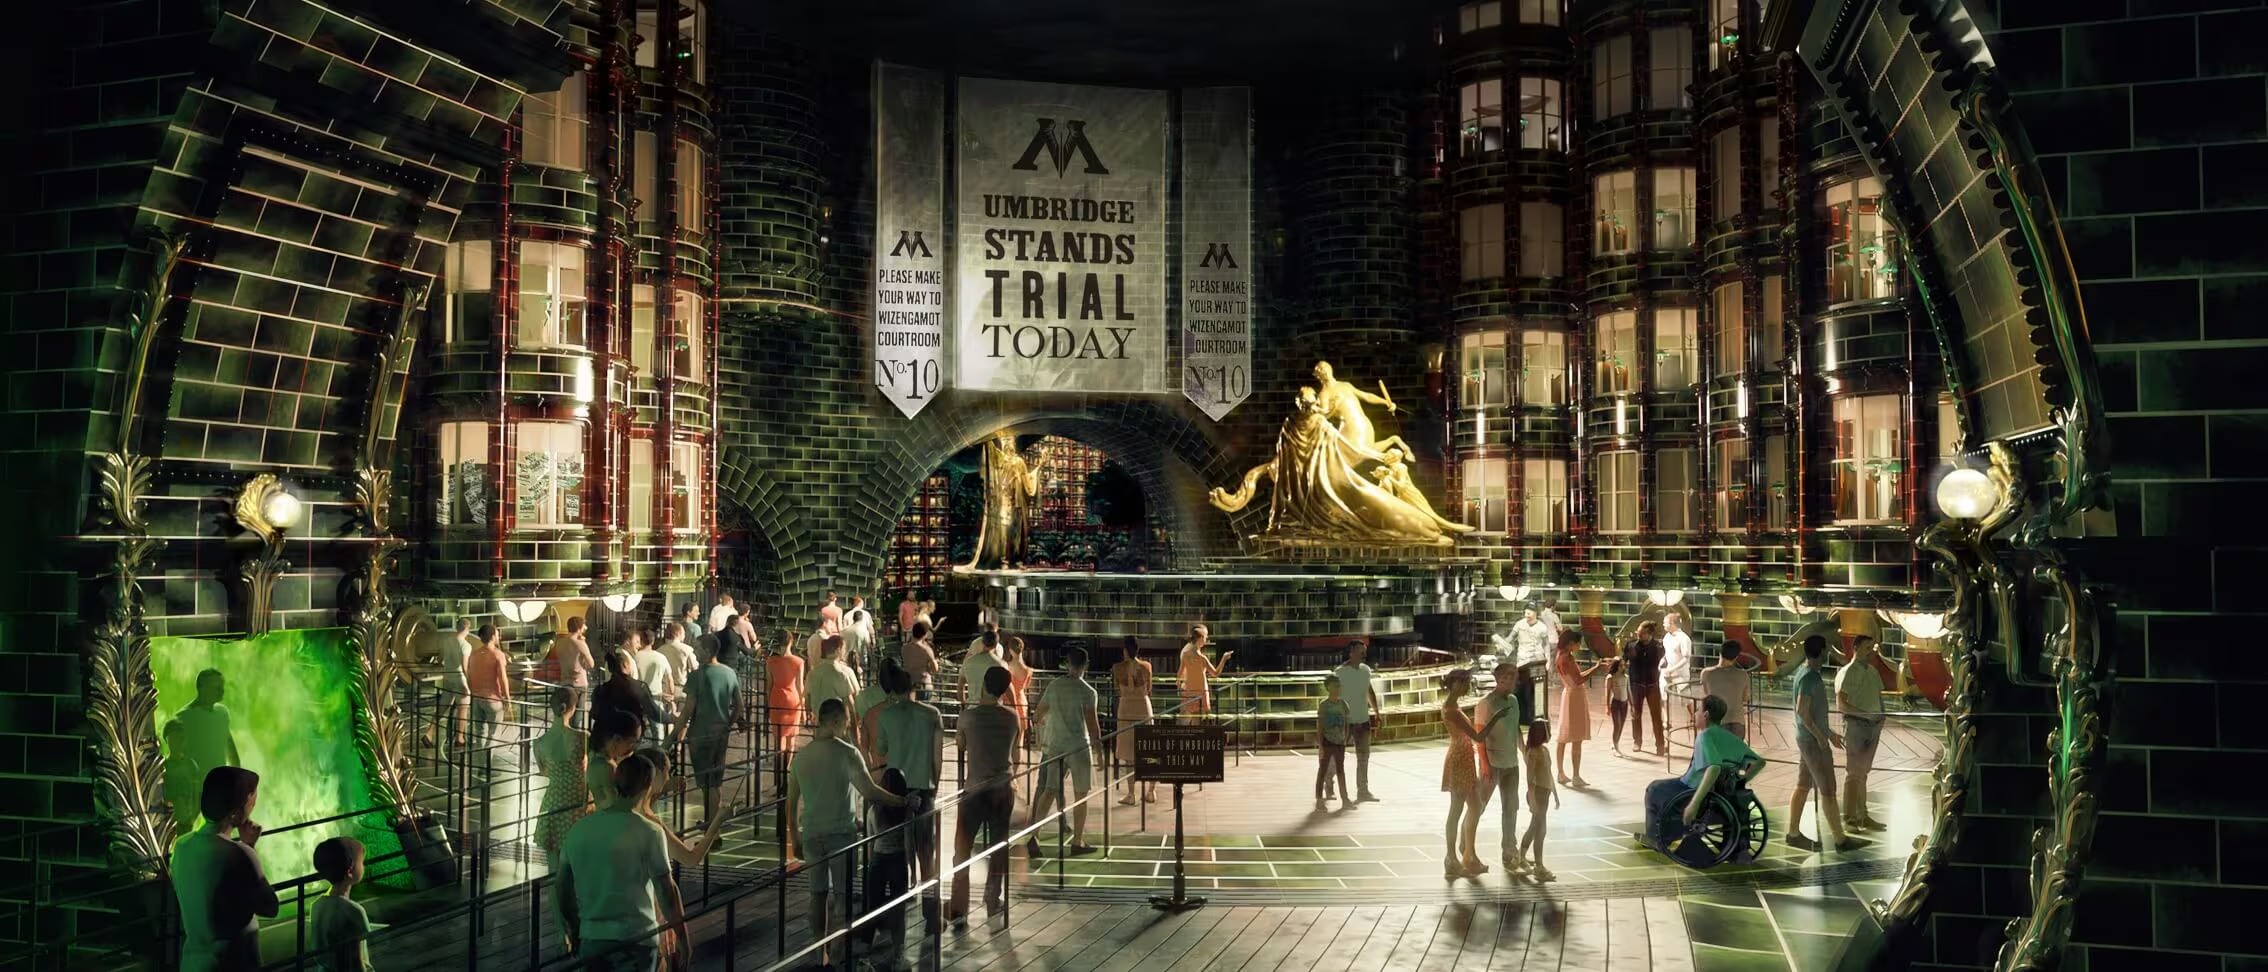
Harry Potter and the Battle at the Ministry averaged a wait of 77 minutes this month.

Universal
That’s a drop of nine minutes from the attraction’s July average.
However, it’s a 40-minute drop from last August’s average.
Universal
This is the signature attraction at Epic Universe, and it’s still averaging a long-ish wait.
That wait was much, MUCH longer at this time a year ago, though.

Universal
That’s terrific news for anyone visiting the park in August.
For Comcast officials, it’s the kind of trending that causes emergency meetings.

Comcast
Well, I’m saying that under the assumption that it’s a parkwide trend.
We still have one vital themed land to evaluate. So, let’s do that.
The Wait Times at Super Nintendo World

Here’s where your eyes may bulge a bit.
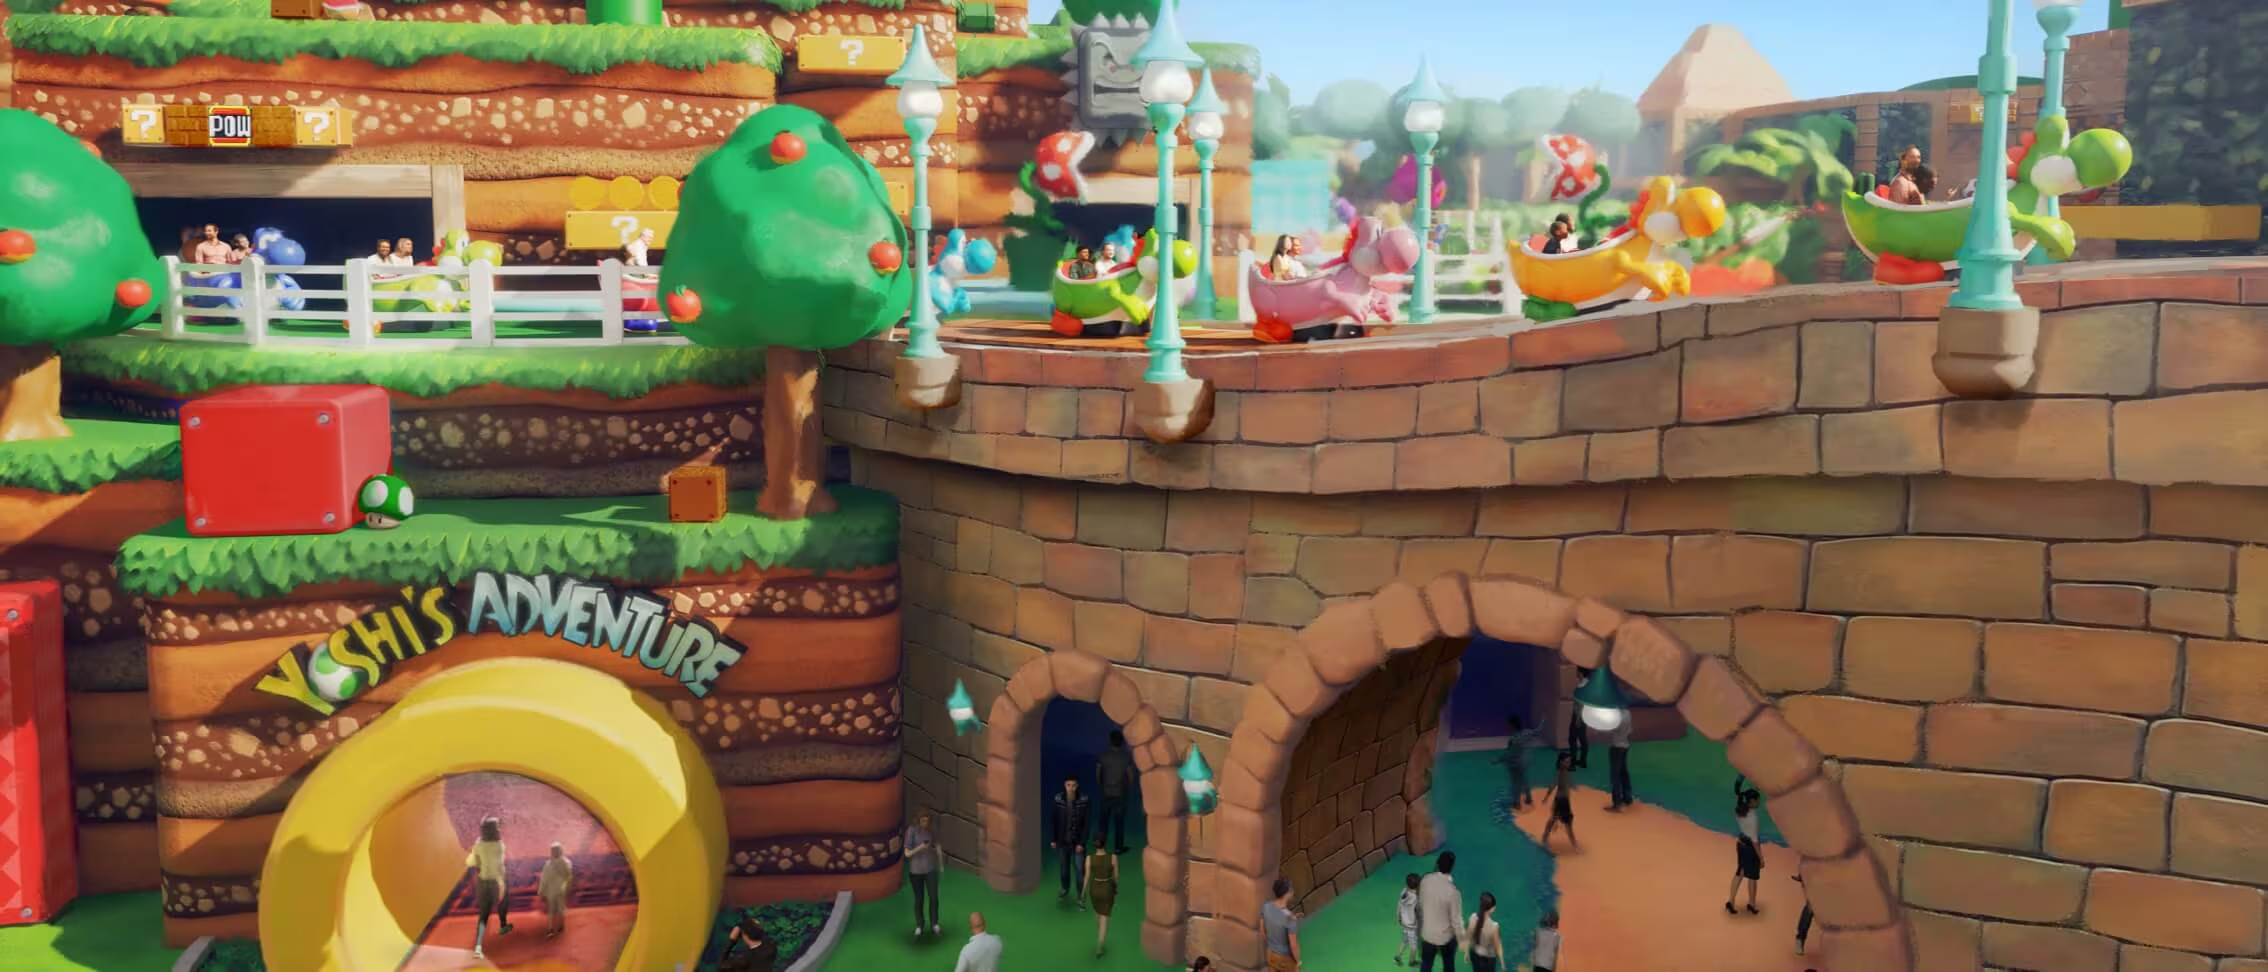
These are the average wait times at Super Nintendo World in August:
- Mine-Cart Madness – 89 minutes, down 21
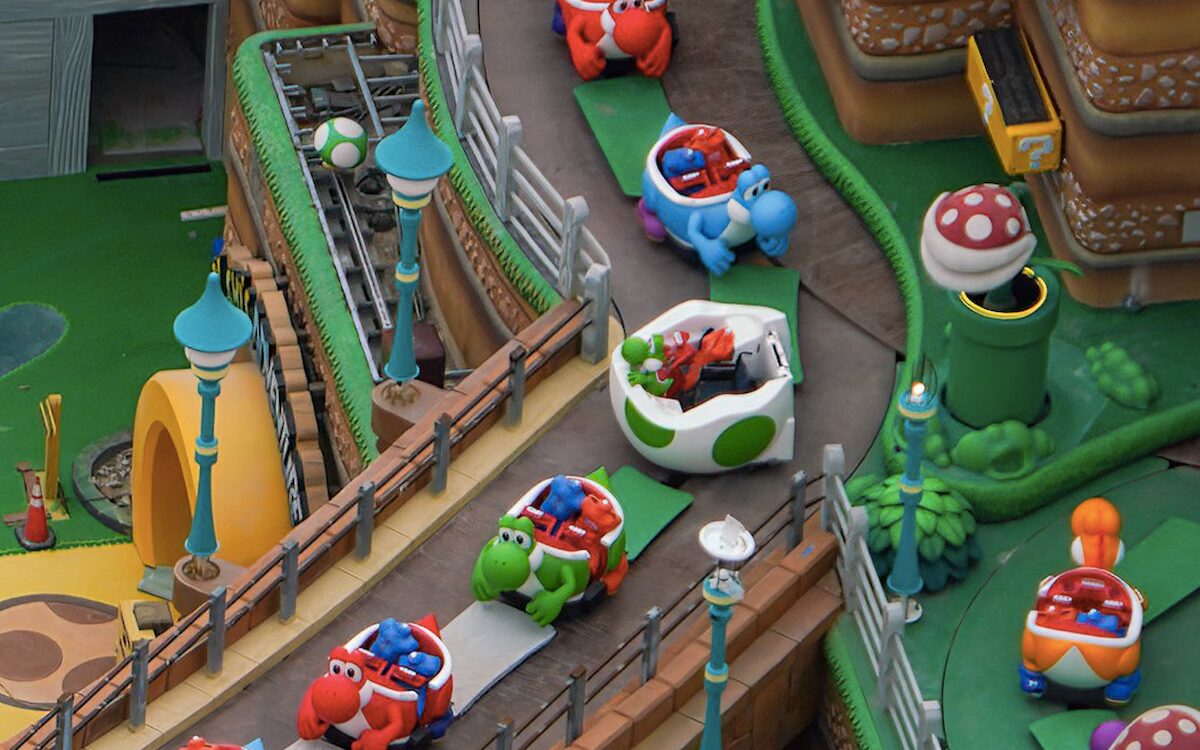
- Mario Kart: Bowser’s Challenge – 56 minutes, down 18
- Yoshi’s Adventure – 39 minutes, down 5
Universal
These were the average wait times in August 2025:
- Mario Kart: Bowser’s Challenge – 108 minutes, down 29
- Mine-Kart Madness – 106 minutes, up 7
- Yoshi’s Adventure – 50 minutes, down 10
Just so that you don’t think I’m messing with the numbers, here’s a link to last year’s analysis.

Photo: Universal
At the time, I was giddily optimistic, with my biggest concern that the wait times were too long.
That is most assuredly not a problem as we enter September 2026.
Attractins magazine
Well, it’s not as much of a problem. Harry Potter and Mine-Cart Madness remain an issue.
Still, Mario Kart’s down nearly half in a year, which is great for you, just not great for Comcast.
The Other Wait Times
Attraction Insight
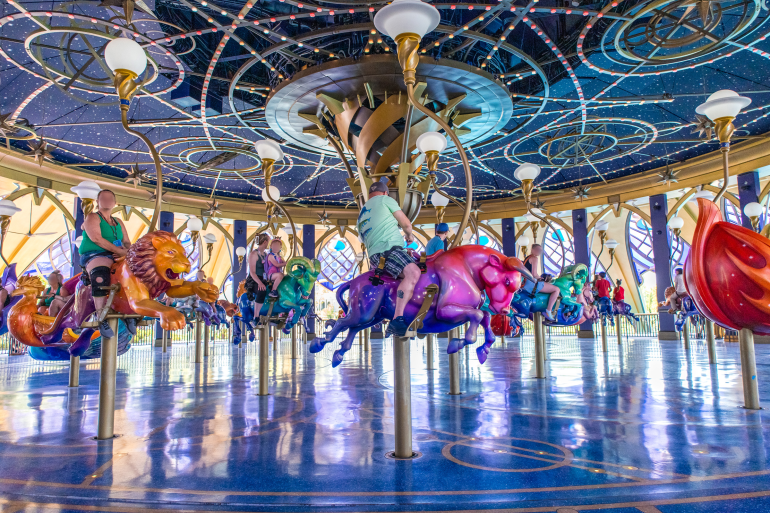
Finally, we have the park’s other two attractions, both of which remain under 30 minutes:
- Stardust Racers – 26 minutes, down 3
- Constellation Carousel – 19 minutes, down 1
So, the good news is that you can do both in an hour and have a lot of fun.

Universal
The bad news is that Stardust Racers averaged a 43-minute wait a year ago.
Amusingly, Constellation Carousel remained the same. It’s usually in this range.
Universal
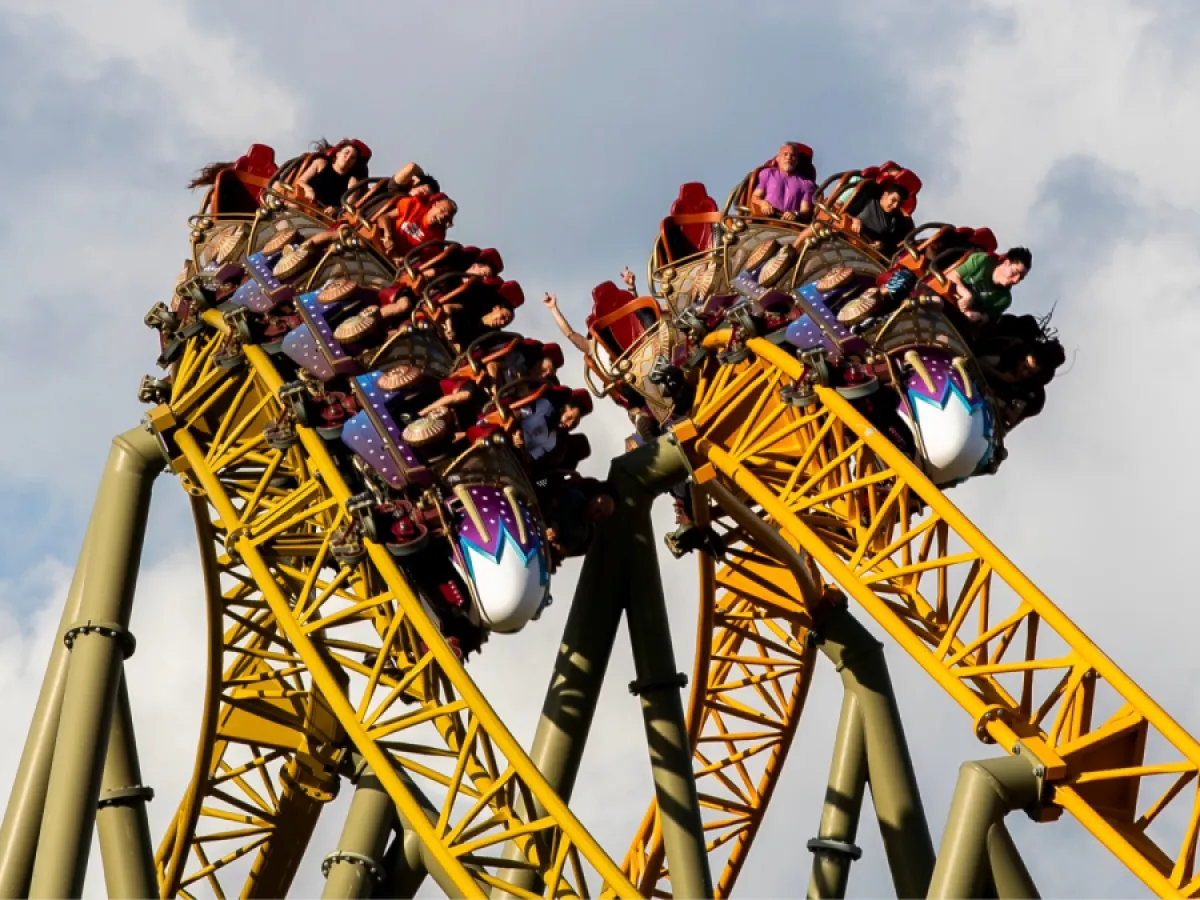
The Stardust Racers drop likely suggests a combination of three factors.
Undeniably, the park is much less crowded this year due to overall attendance issues at Universal Orlando Resort.
OC Register
Also, demand would have dropped in year two anyway, as that’s how these things work.
Finally, the Stardust Racers tragedy has irrefutably damaged its reputation.

All these factors contribute to the park’s overall performance in August.
The average attraction required a 43-minute wait, five minutes less than in July.
EPIC
To a larger point, the average attraction stood at a 65-minute wait a year ago.
That’s a substantial drop in a calendar year.

Thanks for visiting UniversalParksBlog.com! Want to go to Universal? For a FREE quote on your next Universal vacation, please fill out the form below and one of the agents from Let’s Adventure Travel will be in touch soon! Thank you!
Feature Photo: Universal